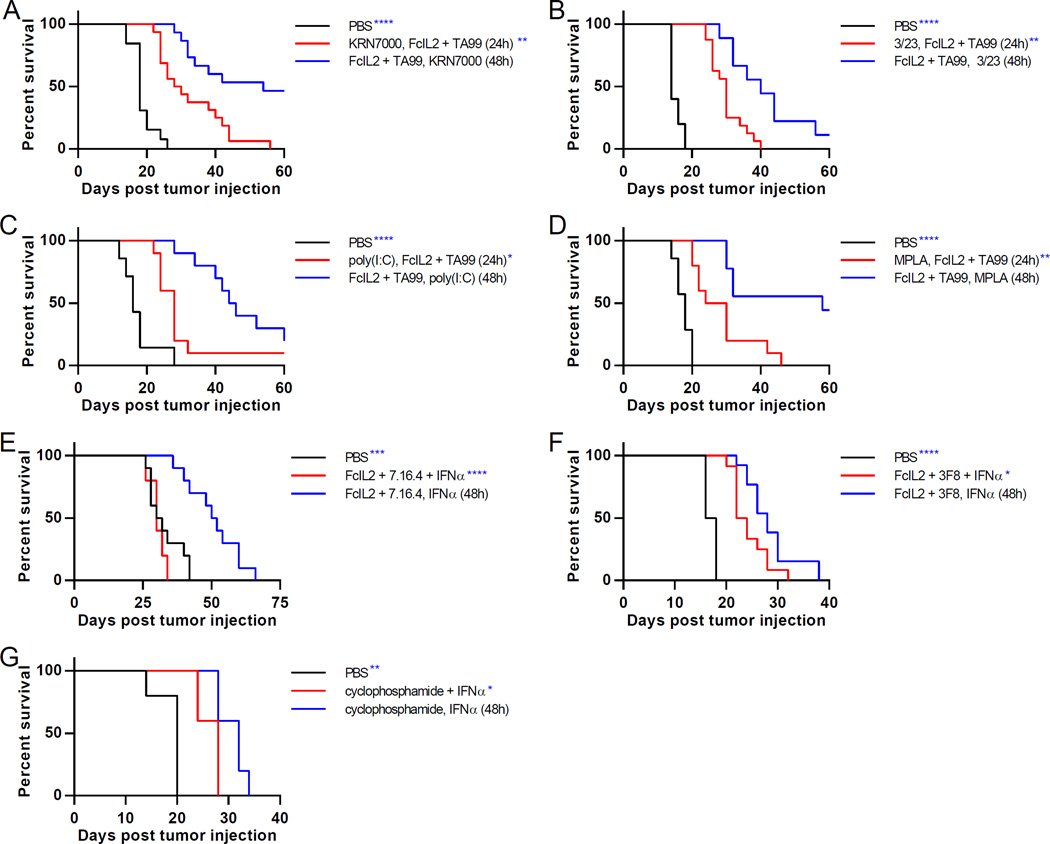
Figure 4. Schedule-Dependent Synergy is Generalizable to a Wide Range of Combination Immunotherapies in Various Tumor Models.
(A–D) Survival curves for mice injected s.c. with 106 B16F10 melanoma cells, then treated on days 6 and 12 with PBS or FcIL2 + TA99. Mice given FcIL2 + TA99 also received KRN7000, 3/23, poly(I:C), or MPLA at indicated times. n = 13–15 per group.
(E) Survival curves for mice injected s.c. with 106 DD-Her2/neu breast cancer cells, then treated on days 6 and 12 with PBS or FcIL2 + 7.16.4. Mice given FcIL2 + 7.16.4 also received IFNα at indicated times. n = 5–10 per group.
(F) Survival curves for mice injected s.c. with 2.5×10⁴ RM9 prostate cancer cells, then treated on days 6 and 12 with PBS or FcIL2 + 3F8. Mice given FcIL2 + 3F8 also received IFNα at indicated times. n = 12–13 per group.
(G) Survival curves for mice injected s.c. with 106 B16F10 melanoma cells, then treated on days 6 and 12 with i.p. PBS or cyclophosphamide. Mice given cyclophosphamide also received IFNα at indicated times. n = 5 per group.
*p < 0.05; **p < 0.01; ***p < 0.001; ****p < 0.0001 versus the corresponding color group in the legend. See also Figure S5.

