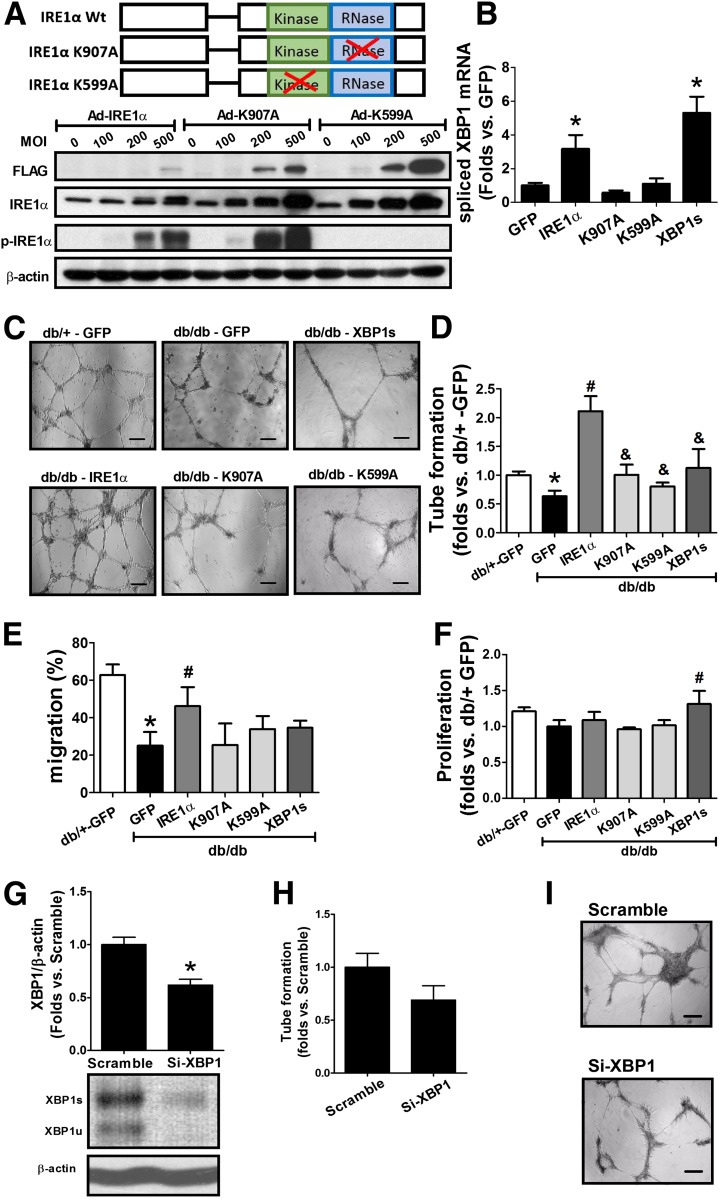
Figure 2.
Augmentation of IRE1α RNase activity boosts BMPC function in diabetes. BMPCs were isolated from individual mice and transfected with flag-tagged Ad-IRE1α, Ad-K907A, Ad-K599A, or Ad-XBP1s, using adenovirus carrying GFP as controls. Flag-tagged protein and total IRE1α protein expression were determined by Western blot analysis. The XBP1s mRNA levels were determined by qRT-PCR. A: Flag-tagged IRE1α and total IRE1α protein expression in db/db BMPCs after infection with flag-tagged Ad-IRE1α, Ad-K907A, or Ad-K599A at 0, 100, 200, 500 MOI for 48 h. B: qRT-PCR analysis of XBP1 mRNA splicing in BMPCs infected with Ad-IRE1α, Ad-K907A, Ad-K599A, or Ad-XBP1s. n = 6. *P < 0.05 vs. Ad-GFP. C: Representative pictures showing tube formation of db/db BMPCs transfected with Ad-IRE1α, Ad-K907A, Ad-K599A, Ad-XBP1s, or Ad-GFP at 500 MOI for 48 h, respectively. db/+ BMPCs transfected with Ad-GFP served as normal controls. Bar = 500 μm. D: Bar graph of tube formation quantification. n = 6 per group. *P < 0.05 vs. db/+ + Ad-GFP; #P < 0.05 vs. db/db + Ad-GFP; &P < 0.05 vs. db/db + Ad-IRE1α. E: Migration of db/db BMPCs transfected with Ad-IRE1α, Ad-K907A, Ad-XBP1s, or Ad-GFP as evaluated by in vitro wound scratch assay. n = 5 mice per group. *P < 0.05 vs. db/+ + Ad-GFP; #P < 0.05 vs. db/db + Ad-GFP. F: Proliferation of db/db BMPCs infected with Ad-IRE1α, Ad-K907A, Ad-XBP1s, or Ad-GFP as evaluated by CellTiter 96 AQueous Cell Proliferation Assay. n = 5 per group. #P < 0.05 vs. db/db GFP. G: Western blot analysis of XBP1 protein in db/+ BMPCs transfected with XBP1 siRNA (Si-XBP1) or scramble oligo. n = 5 mice per group. *P < 0.05 vs. scramble. H: Tube formation in db/+ BMPCs infected with XBP1 siRNA or scramble oligo. n = 5 mice per group. I: Representative pictures of tube formation in db/+ BMPCs transfected with XBP1 siRNA or scramble oligo. Bar = 500 μm. Wt, wild type.

