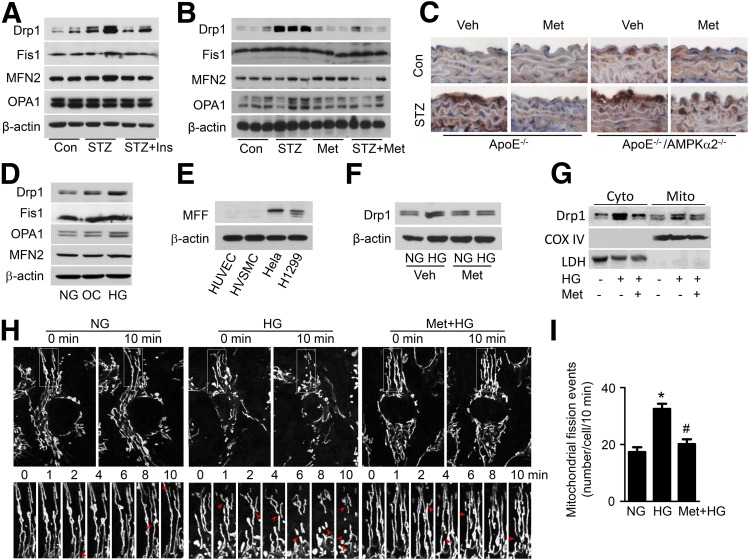
Figure 4.
Metformin downregulates Drp1 expression and mitochondrial fission. STZ-induced diabetic WT mice were intraperitoneally injected with 0.5 units/kg insulin (Ins) for 14 days (A) or administered metformin (Met; 300 mg/kg/d) in drinking water for 4 weeks (B). Mitochondrial dynamics-related proteins, including Drp1, mitochondrial Fis1 protein, MFN2, and OPA1, in the aorta were analyzed by Western blotting. C: Representative of immunohistochemical staining of Drp1 on thoracic aortic sections from diabetic ApoE−/− and ApoE−/−/AMPK-α2−/− mice treated with metformin. D: HUVECs were treated with normal glucose (NG), 30 mmol/L d-glucose (high glucose [HG]), or 25 mmol/L mannitol plus 5 mmol/L d-glucose (osmotic control [OC]) for 24 h. Mitochondrial Drp1 protein expression was determined by Western blotting. E: Protein levels of mitochondrial MFF in HUVECs, HVSMCs, HeLa cells, and H1299 cells. F–I: HUVECs were pretreated with 2 mmol/L metformin for 2 h, followed by stimulation with high glucose for 24 h. F: Drp1 protein level was measured by Western blotting. G: Western blot analysis of Drp1 protein levels in cytoplasmic (Cyto) and mitochondrial (Mito) fractions. Cyclooxygenase (COX) IV and lactate dehydrogenase (LDH) were used as mitochondrial and cytosolic markers, respectively. H: Mitochondrial morphology in live HUVECs stained with MitoTracker Deep Red FM was captured using time-lapse confocal microscopy. Images were collected at 1-min intervals for 10 min. I: Quantification of mitochondrial fission events in live HUVECs. n = 15. *P < 0.05 vs. NG; #P < 0.05 vs. HG. Veh, vehicle.

