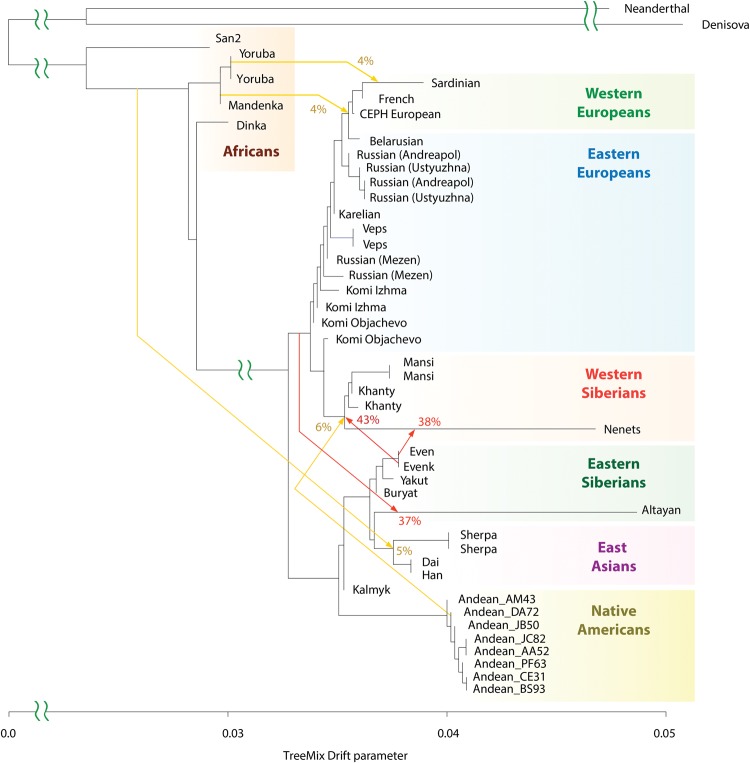
Figure 2.
Genetic relationships of modern-day Siberian, Asian, Native American, European, and African populations. Autosomal TreeMix admixture graph based on whole-genome sequencing data from 44 individuals primarily from Africa, Europe, Siberia, and America. The x-axis represents genetic drift, which is proportional to the effective population size Ne. Admixture events are shown with arrows, with admixture intensities indicated by percentages. Residuals are shown in Supplemental Figure S5.

