Figure 4.

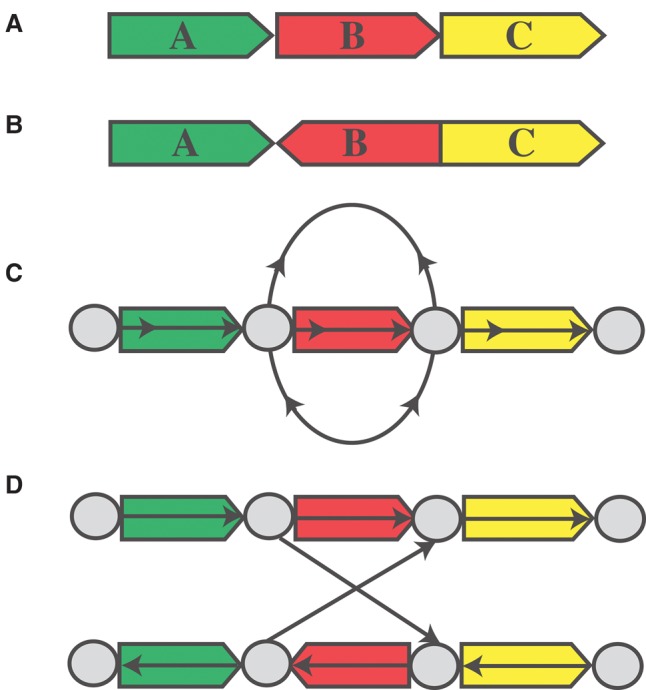
Tumor adjacency graph. (A,B) Reference and tumor genome, respectively. (C) The bidirected graph representation of the tumor genome. (D) The directed graph equivalent to C.

Tumor adjacency graph. (A,B) Reference and tumor genome, respectively. (C) The bidirected graph representation of the tumor genome. (D) The directed graph equivalent to C.