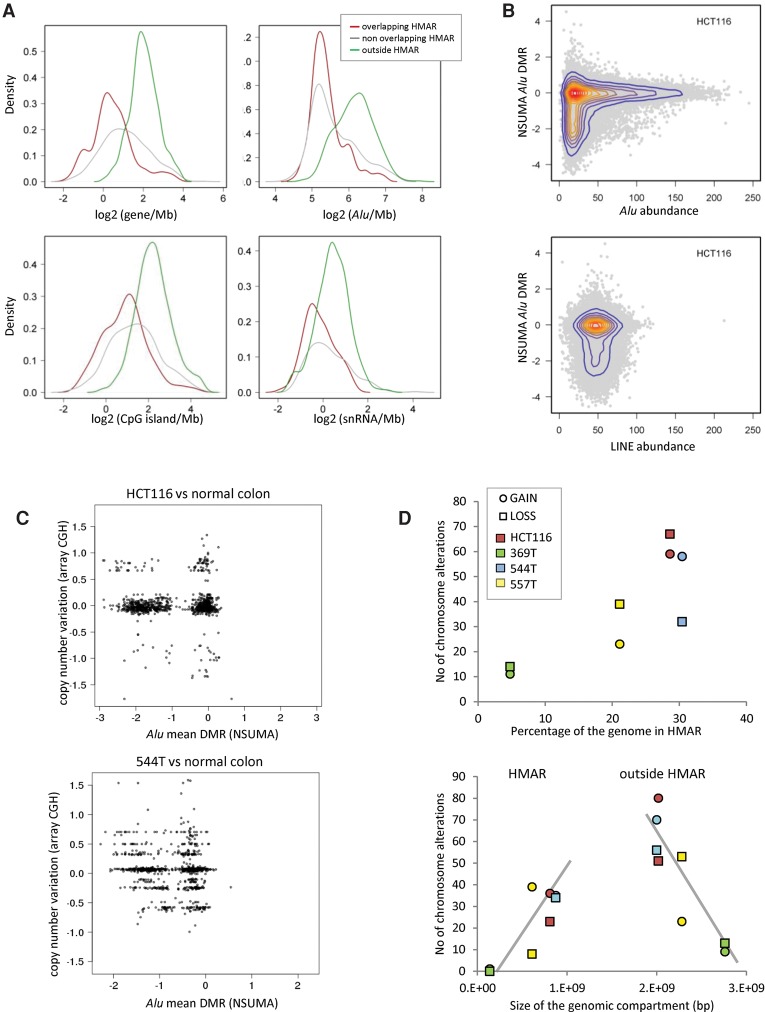
Figure 4.
(A) Density of genomic elements (genes, Alu repeats, CpG islands, and small nuclear RNAs) in genomic segments according to the Alu hypomethylation profiles determined by NSUMA. Overlapping HMAR regions (red line) result from the shared HMARs of three colon tumors and the HCT116 cell line (Supplemental Table S8). Nonoverlapping HMARs (gray line) correspond to hypomethylated regions in tumors or HCT116 but not in both. The rest of the genome (outside HMARs, green line) is neither hypomethylated in tumors nor HCT116 cells. The distribution of other genomic elements is shown in Supplemental Figure S22. (B) Distribution of the Alu differential methylation ratio of HCT116 in regard to Alu and LINE density (elements/100 kb). (C) Distribution of genomic segments according to the Alu mean DMR and the copy number variation in HCT116 and the tumor sample 544T. (D) The upper panel shows the relationship between the extent of the hypomethylated compartment (as percentage of the genome) and the number of regions with chromosomal alterations as detected by array CGH. The lower panel shows the number of chromosome segments with copy number alterations in regard to their location inside or outside HMAR. Tumor samples with a larger hypomethylated compartment show a higher number of alterations in both HMARs and outside HMARs.

