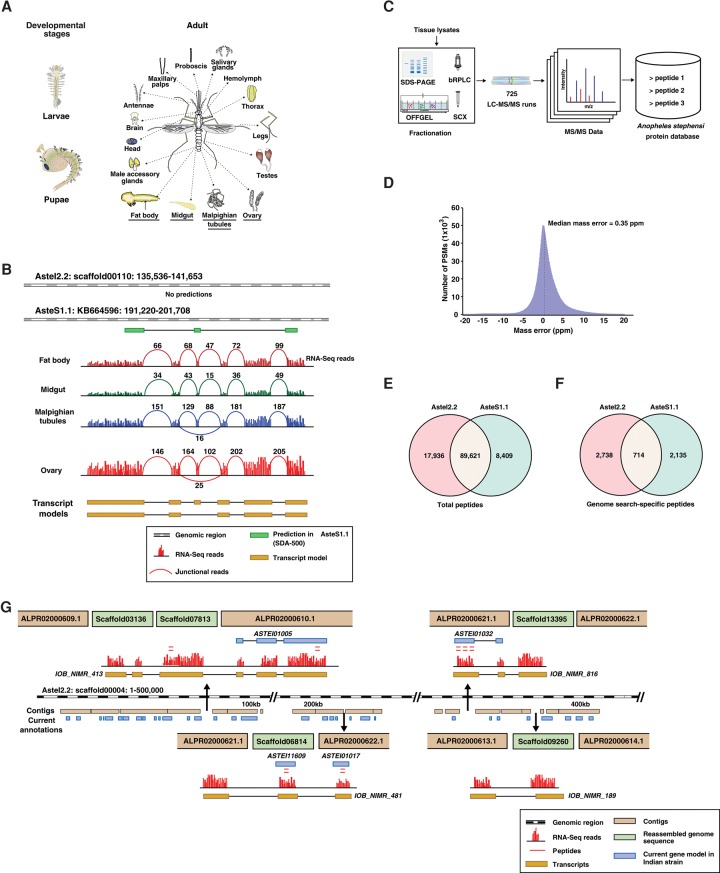
Figure 2.
Schematic representation of the workflow and summary of proteomic data. (A) Adult tissues and developmental stages of the Indian strain of An. stephensi that were dissected and processed for transcriptomic or proteomic analysis. (B) Revised annotation of An. stephensi genome based on RNA-seq evidence. The numbers represent the junctional reads identified in each tissue, and the two transcript models shown are splice variants identified based on RNA-seq data. (C) Broad overview of mass spectrometry–based proteomic analysis of multiple tissues. (D) Median mass error of the peptide spectral matches identified in the study. (E) Total number of peptides identified against AsteI2 and AsteS1 assembly. (F) Total number of genome search-specific peptides identified against the two assemblies. (G) Insertion of five small scaffolds in genome gap regions of scaffold00004.

