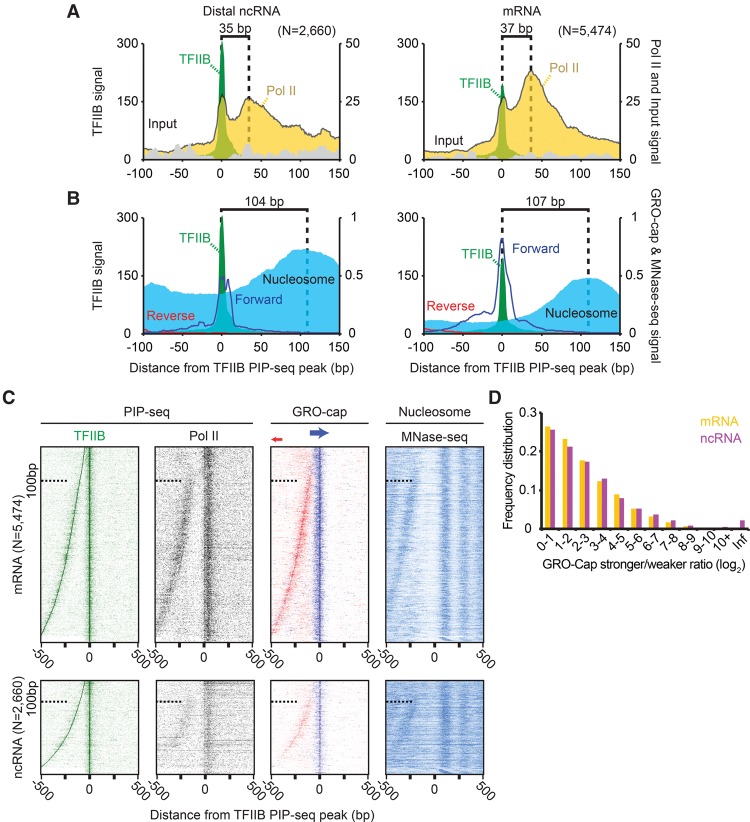
Figure 3.
Equivalence of ncRNA and mRNA initiation complexes organization. (A) Composite plot of TFIIB, Pol II, and input PIP-seq at TFIIB PIP-seq peaks separated by ncRNA and mRNA proximity. Locations were considered ncRNA-associated (left panel; N = 2660) if located >1 kb from an annotated mRNA TSS and considered mRNA-associated (right panel; N = 5474) if <1 kb away. Dashed lines represent the distance between the TFIIB and Pol II PIP-seq local maxima. (B) Same as panel A, but displaying strand-separated GRO-cap RNA (blue and red lines) and nucleosomes. Dashed lines represent the distance between the TFIIB PIP-seq and MNase-seq local maxima. (C) Heatmap of TFIIB and Pol II PIP-seq, GRO-cap RNA, and nucleosomes sorted by the distance between the TFIIB PIP-seq peak and the closest TFIIB PIP-seq local maxima located between 50 and 500 bp upstream. (D) The log2 ratio of GRO-cap RNA on opposing strands (stronger/weaker) was binned, separated into mRNA and ncRNA classes, and plotted as a frequency distribution. Initiation complexes were assigned infinity (Inf) if there was no detected GRO-cap signal on one of the strands.

