Figure 4.
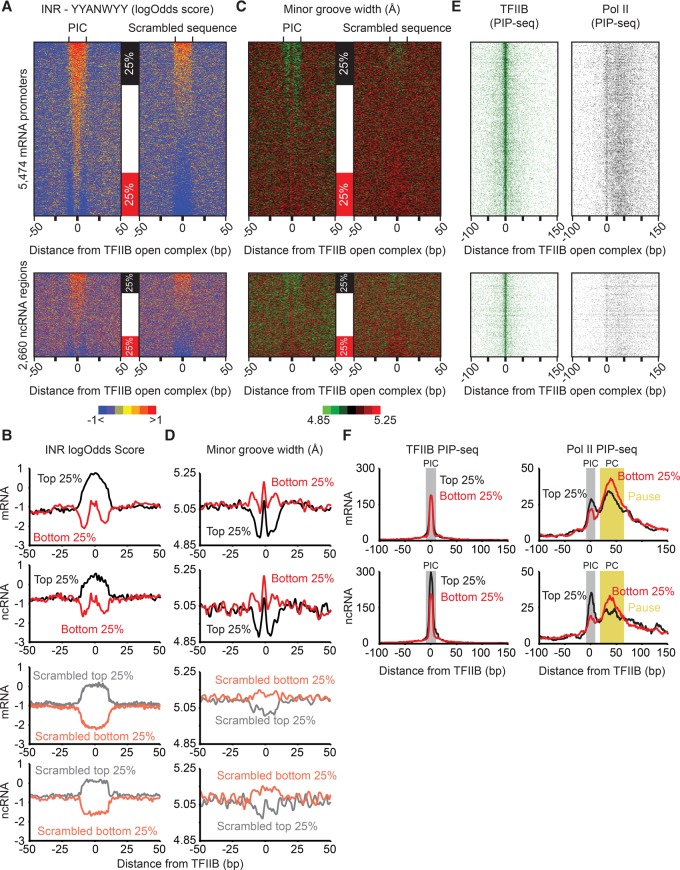
Genomic DNA architecture of PICs. (A) Genomic sequences (100 bp in each row) surrounding TFIIB PIP-seq peaks (N = 8134) or their scrambled 100-bp counterparts were scanned with the YYANWYY (IUPAC nomenclature) (Smale and Baltimore 1989) consensus in a sliding window to calculate log-likelihood ratios (Stormo 2000). Rows for the PIC and scrambled sequence were then sorted independently of each other based on the average score in a 20-bp window that was centered on each TFIIB peak. (B) The top and bottom 25% of rows from panel A were used to generate composite plots. (C) Minor groove widths were calculated (Zhou et al. 2013) for the sequences defined in panel A and sorted based on panel A. (D) The top and bottom 25% of rows from panel C were used to generate composite plots. (E) TFIIB and Pol II PIP-seq tags were aligned and sorted based on panel A. (F) The top and bottom 25% of rows from panel E were used to generate composite plots. The initiation and pause regions are highlighted in gray and yellow, respectively.

