Figure 2.
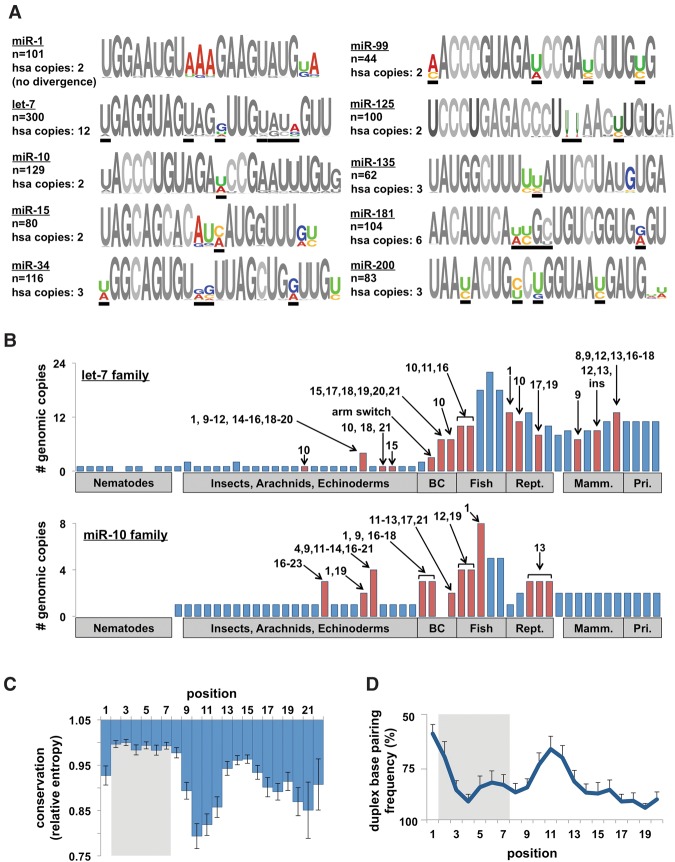
Evolutionary patterns of highly conserved miRNA families. (A) Sequence logos for 10 representative miRNA families from all metazoan species. Colored nucleotides represent highly variable positions across species (hotspots). Number of miRNAs in each family and the number of copies in the human genome are noted. Black bars represent the positions that are variable within the human families. (B) The number of family members of let-7 and miR-10b in metazoan species. Arrows and numbers specify the position(s) of nucleotide changes within the mature miRNA relative to the nearest species. The numbers represent changes unique to that species, not cumulative changes. Red bars denote species with sequence changes. (C) We calculated the conservation score (entropy) of each position in all 62 families and combined them to reveal general trends in sequence evolution. Conservation score normalized to most conserved position (p3). (D) Frequency of base-pairing between miRNA/miRNA* strands in the miRNA duplex. Base-pairing information was extracted from alignments on miRBase. This figure is representative of 62 families in eight species.

