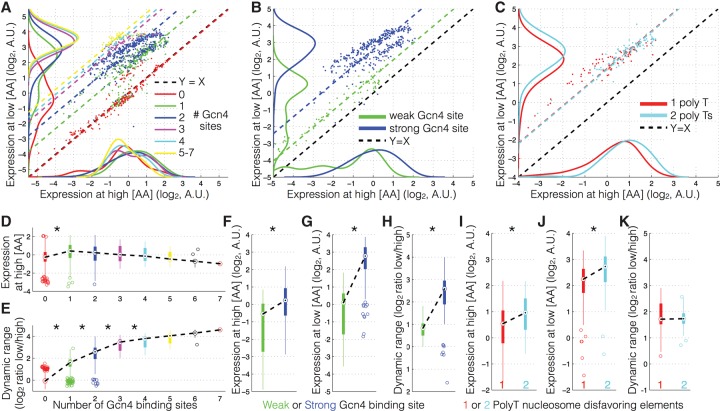
Figure 2.
The effect of Gcn4 binding site number and polyT nucleosome disfavoring sequences on [TF]-dependent and -independent expression. (A–C) Expression at high [AA] (x-axis) versus expression at low [AA] (y-axis) for various promoter sequence features. Dashed lines are the diagonal (slope = 1) line that best fit each category of promoters. The black dashed diagonal line (Y = X) represents the regime where expression is constant across conditions. The vertical distance from the Y = X line measures how much any one promoter changes in expression across conditions. Density plots (using ks density estimation) at the x-axis and y-axis show the distributions of expression values for each promoter at high and low [AA], respectively. (D–K) Expression and expression fold-change (y-axis) in box plots as a function of promoter sequence features (x-axis). The dashed black lines connect the medians of each box. Asterisks denote statistically significant (t-test, P < 0.01) changes between subsequent groups. (A) Shown are promoters grouped by the number of Gcn4 binding sites. (B) Shown are promoters with either low- or high-affinity Gcn4 sites. (C) Shown are promoters with either one or two polyT nucleosome disfavoring sequences. (D,E) Box plots of the data in A. Promoters are grouped by the number of binding sites. (D) Shown is expression at high [AA] (y-axis). (E) Shown is expression fold-change—dynamic range, log2(low [AA]/[high AA]). (F–H) Box plots of the data in B. Shown are expression at high [AA] (F), low [AA] (G), and expression fold-change (dynamic range) (H) for promoters with low- or high-affinity binding sites. All differences are statistically significant (t-test, P < 1 × 10⁻³, P < 1 × 10⁻⁵, P < 1 × 10⁻⁴ for F–H, respectively). (I–K) Box plots of the data in C. Shown are expression at high [AA] (I), low [AA] (J), and expression fold-change (dynamic range) (K) for promoters with either one or two polyT sequences. Expression at high and low [AA] shows significant change as a function of polyT number (t-test, P < 1 × 10⁻⁴, P < 1 × 10⁻⁴, respectively); however dynamic range does not change significantly (t-test, P = 0.77).

