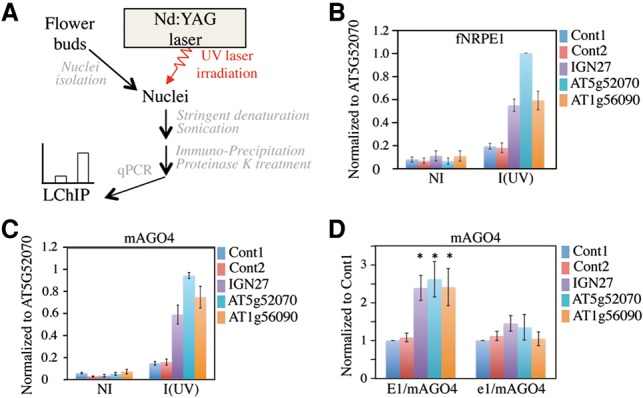
Figure 4.

Detection of AGO4–DNA interactions at RdDM loci by LChIP. (A) Scheme of LChIP. (B) LChIP analysis of Pol V binding in a Pol V+-complemented line. Nonirradiated (NI) or irradiated [I (UV)] nuclei were used to prepare chromatin. ChIP was then performed using anti-Flag antibodies. The RdDM target loci tested are indicated at the right. Cont1 and Cont2 correspond to two independent regions located 2 kb from the At4g04920 gene and represent negative controls. Values of DNA enrichment were calculated as percentage of input and were normalized to At5g52070. Error bars are SEM of three independent ChIP experiments. (C) LChIP analysis of mAGO4 binding in an E1/mAGO4-complemented line. Nonirradiated (NI) or irradiated [I (UV)] nuclei were used to prepare chromatin. ChIP was then performed using anti-myc antibodies. The RdDM target loci tested are indicated at the right. Cont1 and Cont2 represent negative controls. Values of DNA enrichment were calculated as percentage input and were normalized to At5g52070. Error bars are SEM of three independent ChIP experiments. (D) LChIP analysis of mAGO4 binding in E1/mAGO4-complemented versus e1/mAGO4-complemented lines. ChIP was then performed using anti-myc antibodies on irradiated nuclei. The RdDM target loci tested are indicated at the right. Cont1 and Cont2 correspond to two independent regions located 2 kb from the At4g04920 gene and represent negative controls. Values of DNA enrichment were calculated as the percentage of input and were normalized to Cont1. Error bars are SEM of three independent ChIP experiments. (*) P < 0.05 compared with Cont1. n = 3.
