
Figure 2.
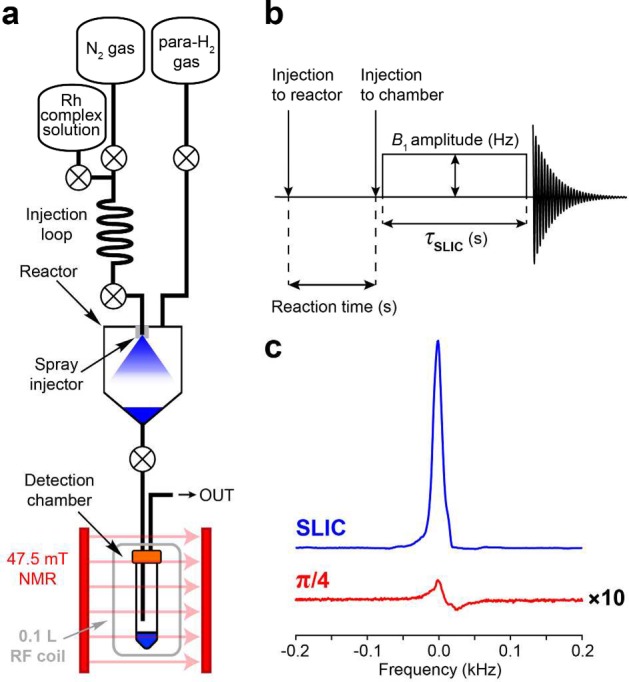
(a) Schematic diagram of experimental setup. The reactor was kept at 50–60 °C. (b) Sequence of events: injection of Rh complex solution (in CH3OH or in H2O) into reactor filled with ∼7.8 atm of p-H2, variable reaction time, injection into the detection chamber located inside a 47.5 mT magnet, subsequent application of SLIC pulse and signal acquisition. (c) 1H NMR signal of HEP in methanol obtained after application of SLIC pulse (blue) and NMR signal obtained after application of a hard π/4 RF pulse (red); note the scaling by a factor of 10.