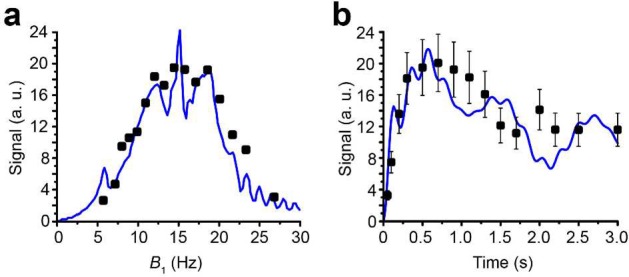
Figure 4.

(a) Dependence of the SLIC signal of HEP in methanol (normalized to the thermal signal of the solvent) vs B1 amplitude at the SLIC duration (τSLIC) of 0.6 s; black squares correspond to experimental results, and blue line corresponds to simulation assuming ±5 Hz RF pulse offset (i.e., simulating B0 inhomogeneity). (b) Dependence of the SLIC signal vs SLIC duration (time) at B1 amplitude of 15 Hz; black squares correspond to experimental results, and blue line corresponds to simulation.
