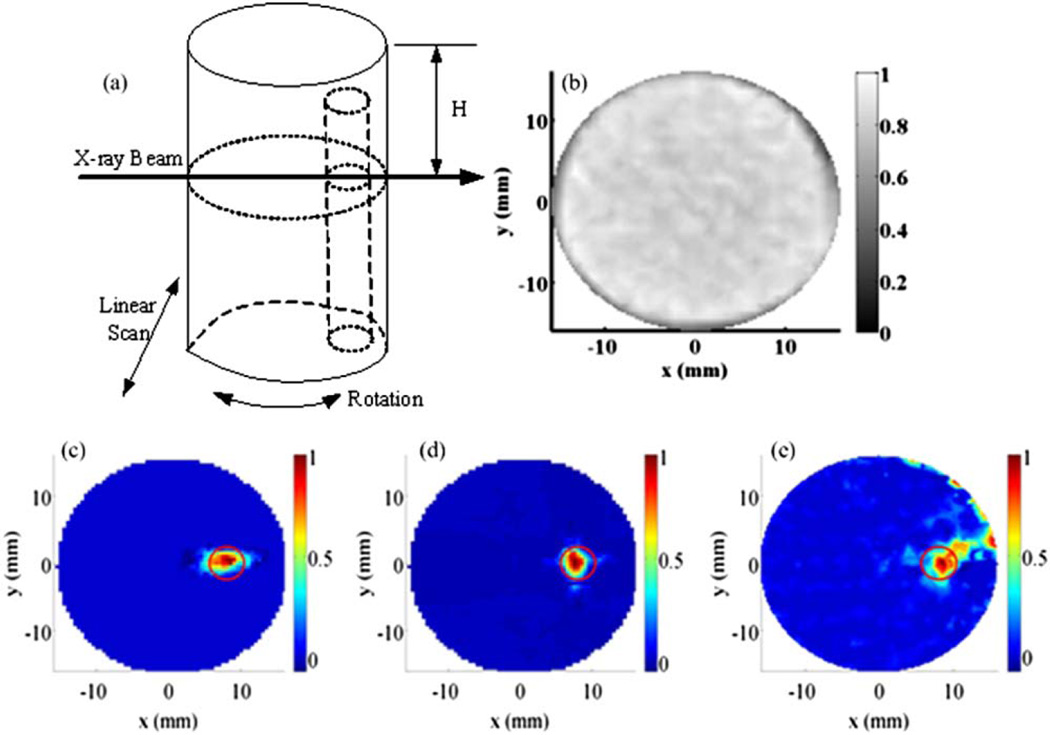
Fig. 2.
(a) Schematic of a phantom and the scanning scheme. (b) Reconstructed pencil beam CT image for phantom set 1. (c) Reconstructed XLOT images for GOS:Eu concentration of 1 mg/ml with 1 projection measurement, (d) 2 projection measurements, and (e) 36 projection measurements. The red circle indicates the actual target location.

