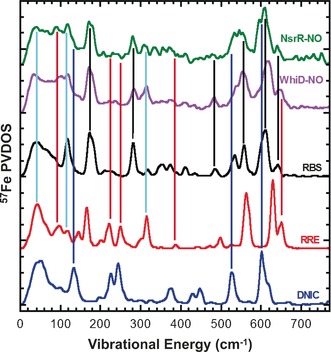
Figure 4.

Comparison of NRVS spectra of DNIC, RRE, and RBS with those of WhiD‐NO and NsrR‐NO. Black, red, and blue lines indicate the signals that correspond to the RBS, RRE, and DNIC model compounds, respectively. Light blue lines highlight the signals that appear in both WhiD‐NO and NsrR‐NO samples and both RBS and RRE model spectra. RRE and DNIC models utilized methyl thiolate ligands.
