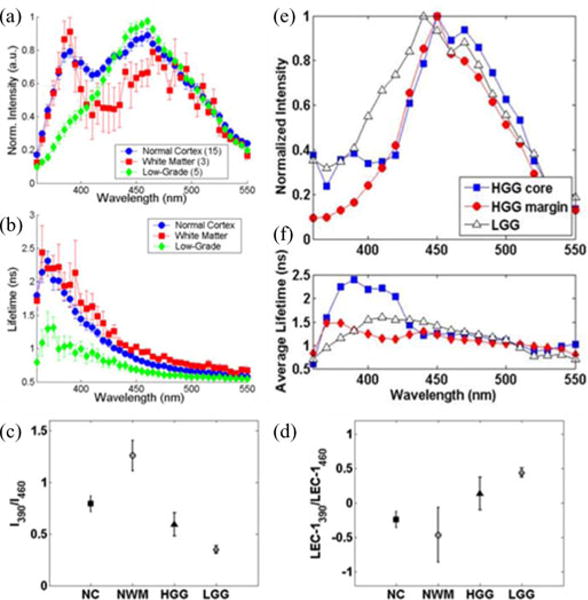
Fig. 4.

Representative fluorescence emission characteristics of distinct brain tissue types (NC, NWM, and LGG). (a) Fluorescence emission spectra. (b) Average fluorescence lifetime. Representative fluorescence parameters (ratio 390 nm versus 460 nm) of (c) absolute fluorescence intensities and (d) Laguerre coefficient (order 1). Adapted from [32]. TRFS features from measurements conducted in two patients: one diagnosed with HGG (measurements conducted in both tumor core and margins) and the other with LLG. (e) Fluorescence emission spectra. (f) Average lifetimes. Note the changes in the fluorescence parameters of HGG (core versus margins of the tumor within the same patient). Also note the differences between the spectroscopic characteristics of HGG and LGG: HHG presents right-shifted peak emission versus LLG and the fluorescence lifetime of the HGG margin is shorter than HHG core, but similar to that of LLG.
