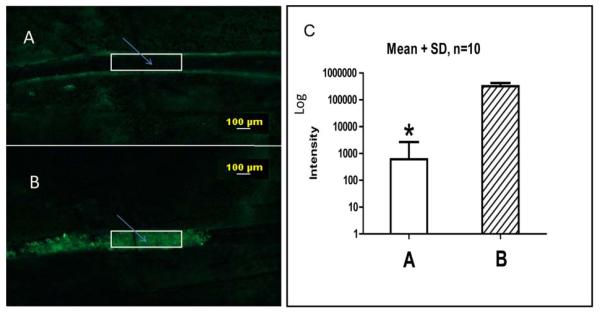
Figure 1.
Platelet fluorescence in a blood vessel before (A) and after (B) clot formation. Fluorescence integrated density (FID) measurements were performed in the lumen in the area marked by the white box. Fluorescent platelets in the area are indicated with an arrow. A bar graph (C) summarizes mean fluorescence intensity in similar areas before and after clot formation in blood vessels in 10 different experiments. The fluorescence intensity scale is logarithmic.

