Figure 1.

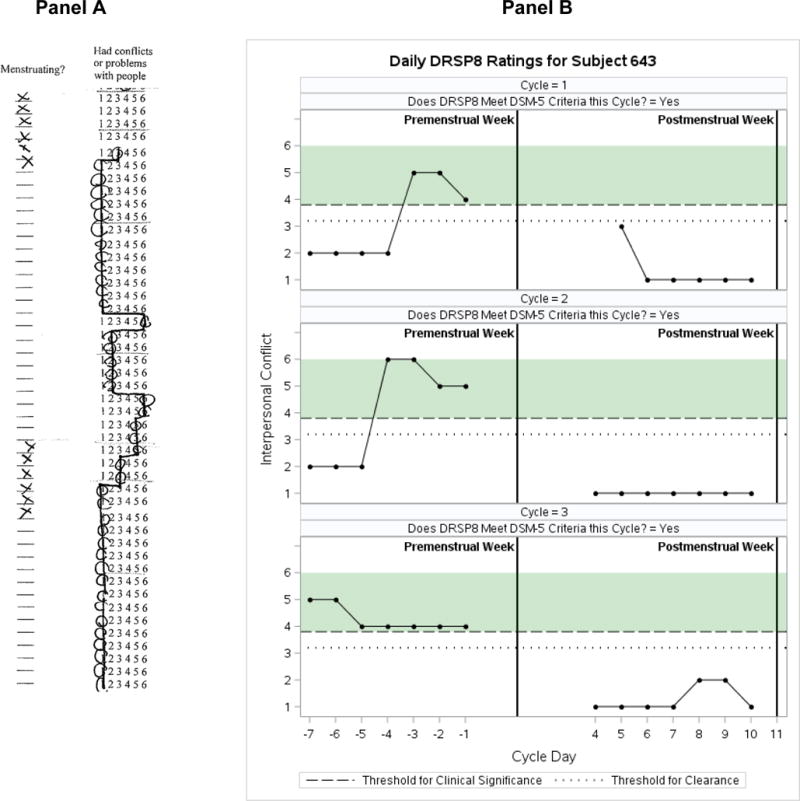
Typical Visualization of DRSP Daily Symptom Ratings Across Two Cycles (Panel A) vs. C-PASS Visualization of DRSP Daily Symptom Ratings Across Three Cycles (produced by the SAS C-PASS Macro; Panel B)

Typical Visualization of DRSP Daily Symptom Ratings Across Two Cycles (Panel A) vs. C-PASS Visualization of DRSP Daily Symptom Ratings Across Three Cycles (produced by the SAS C-PASS Macro; Panel B)