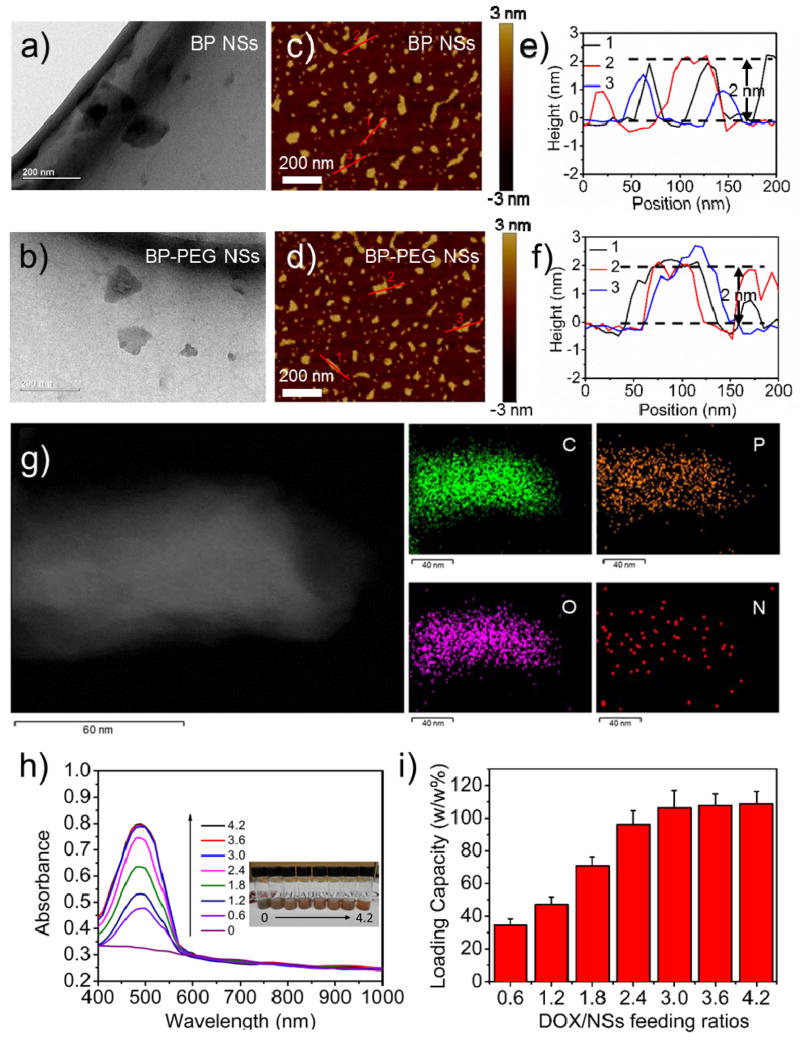
Figure 2.
Characterization of PEGylated BP NSs. TEM images of (a) BP NSs and (b) BP-PEG NSs (scale bar = 200 nm). AFM images of (c) BP NSs and (d) BP-PEG NSs (scale bar = 200 nm). AFM measured thickness of (e) BP NSs and (f) BP-PEG NSs. (g) STEM (scale bar = 60 nm) and EDS mapping (scale bar = 40 nm) of BP-PEG-FA NSs. (h) UV-vis-NIR spectra of BP-PEG/DOX NSs at different DOX/NS feeding ratios after the removal of excess free DOX. (i) DOX loading capacities on BP-PEG NSs (w/w %) with increasing DOX/NS feeding ratios.

