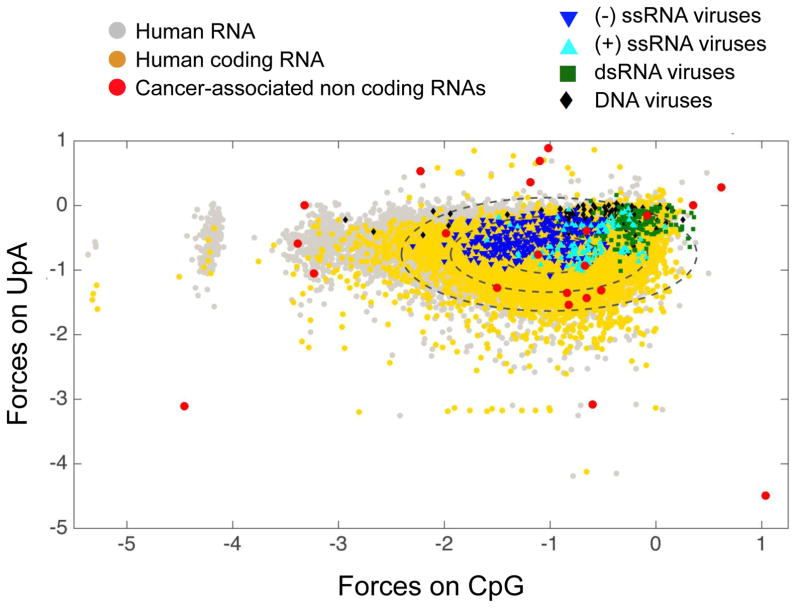
Figure 1. CpG and UpA Dinucleotide Distributions Among Different Classes of Transcripts.
The distribution of forces on CpG and UpA dinucleotides among non-coding and coding RNA allows one to define a landscape of human transcripts (gray dots). Forces represent the entropy penalty for non-random motif usage, with positive forces indicating over-representation and negative under-representation of the motif. Among this landscape, a particular space is occupied by human coding sequences (yellow dots, each ellipse indicates 1 SD from the mean, 95% of transcripts are distributed inside the median ellipse). The same metric applied to human viruses shows that viral genomes occupy a restricted space, yet most human viruses mimic their human host to within two standard deviations, with a set of exceptions, particularly among the dsRNA viruses. Interestingly, several non-coding RNA upregulated in pancreatic and other cancer cells identified in [77] are clear outliers from normal CpG and UpA use (red dots). This figure is an agglomeration of sequences and analyses from [5, 76, 77].

