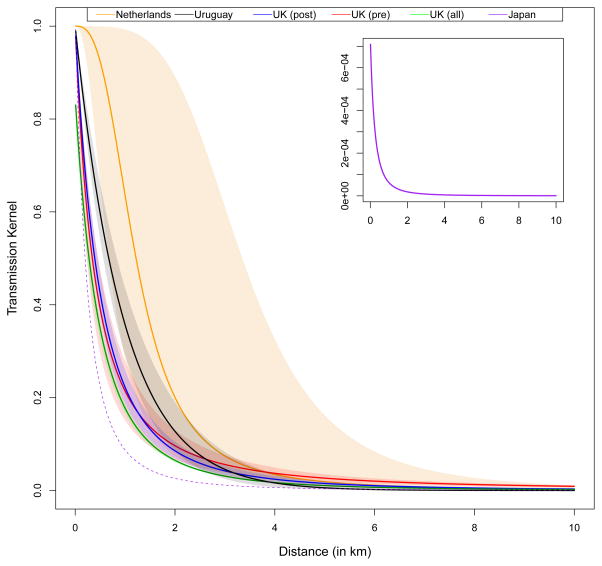
Figure 2. Transmission kernels.
The function that scales transmission with distance was estimated for the Dutch 2001 Panasia O outbreak (orange) (Boender et al., 2010), the Uruguayan 2001 type A outbreak (black) (Chowell et al., 2006), the UK 2001 Panasia O outbreak (red, blue, and green) (Chis Ster et al., 2012, Chis Ster and Ferguson, 2007, Chis Ster et al., 2009), and the Japanese 2010 outbreak (Hayama et al., 2013). The kernels for the UK outbreak were estimated for before the Feb 23rd movement ban (“pre”), after the Feb 23rd movement ban (“post”) or for the entire epidemic (“all”). The shaded regions represent 95% confidence intervals for the Dutch and Uruguayan kernels and 95% credible intervals for the three UK kernels. The Japanese kernel is represented in the upper right panel with a different scale on the y-axis. For comparison with kernels estimated from other locations, the Japanese kernel has been scaled-up and represented by the dotted purple line in the main pane.

