
Figure 1.
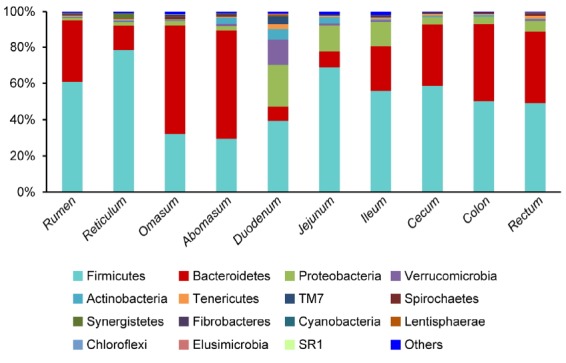
Ribosomal database project (RDP) classification of the sequence reads from different gastrointestinal tracts of sheep at the phylum level. The abscissa (X-axis) represents the different gastrointestinal tract sections, and the ordinate (Y-axis) represents the average relative abundance of the bacterial phyla (n = 5 sheep).