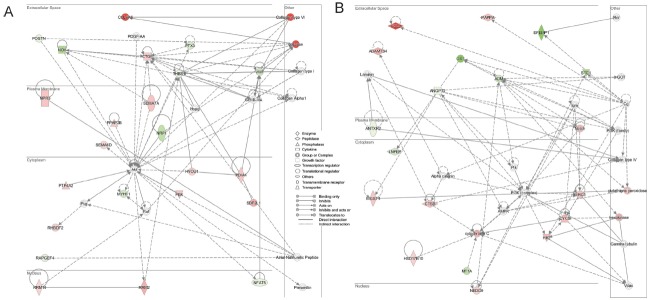
Figure 5.
Two networks (A, B) generated for molecules mapped to the ingenuity pathway analysis database from a data set containing genes differentially regulated between lamb and ewe follicles. Interactions between molecules are shown as explained in the legend, with focus molecule symbols highlighted in color, based on up- (red) or down- (green) regulation in large follicles and of increasing intensity with degree of fold change.

