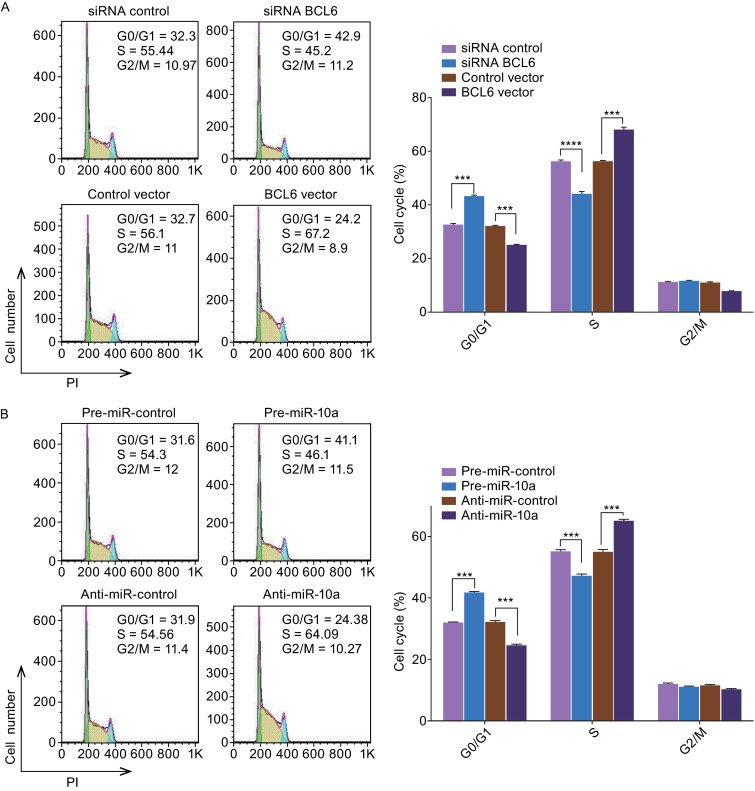
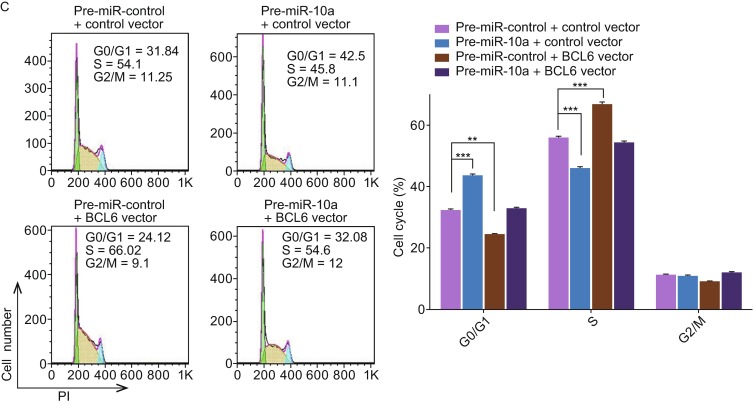
Figure 4.


The role of miR-10a targeting BCL6 in the regulation of cell cycle in DLBCL cells. (A) Cell cycle profiles were analyzed using flow cytometry afer the transfection of OCI-LY7 cells with equal dose of control siRNA, BCL6 siRNA, control vector or BCL6 overexpression vector. (B) Cell cycle profiles were analyzed using flow cytometry afer the transfection of OCI-LY7 cells with equal dose of pre-miR-control, pre-miR-10a, anti-miR-control or anti-miR-10a. (C) Cell cycle profiles were analyzed using flow cytometry afer the transfection of OCI-LY7 cells with pre-miR-control plus control vector, a pre-miR-control plus BCL6 overexpression vector, pre-miR-10a plus control vector, or pre-miR-10a plus BCL6 overexpression vector. The panel shows hisograms of cell numbers (y axis) against DNA content (x axis) determined by measuring fluorescence intensity. Numbers denote the percentages of cells in the G0/G1, S and G2/M phases. Left panel: representative image; right panel: quantitative analysis. Data are the mean ± SEM of 3 independent experiments performed in triplicate, ** P < 0.01; *** P < 0.001
