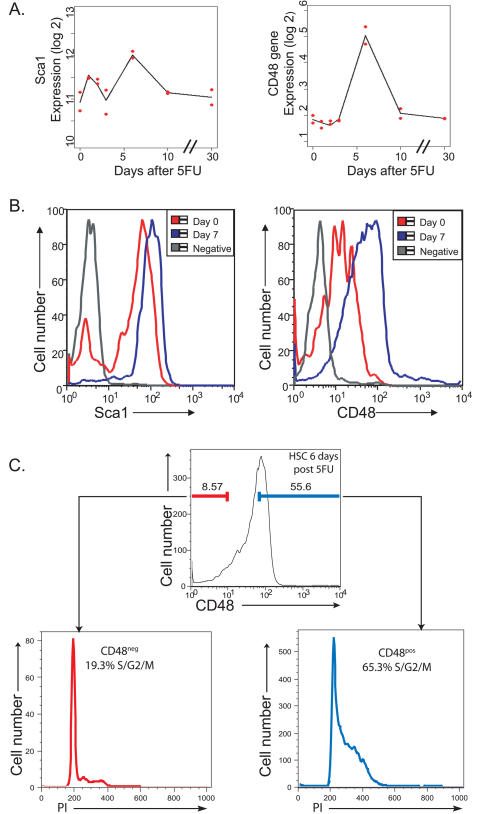
Figure 4. Gene Expression Profiles Correlate with Protein Expression on HSCs.
(A) Gene expression over time. The actual observed values of each replicate at each time point are shown in red, and the line connects the predicted expression value at each time point based on our regression analysis.
(B) Antigen expression on HSCs measured by flow cytometry. Gray lines represent negative control, red lines represent protein expression at day 0, and blue lines represent protein expression at day 7.
(C) Cell cycle analysis of CD48− and CD48+ HSCs isolated 6 d post 5FU treatment.

