Fig. 3.

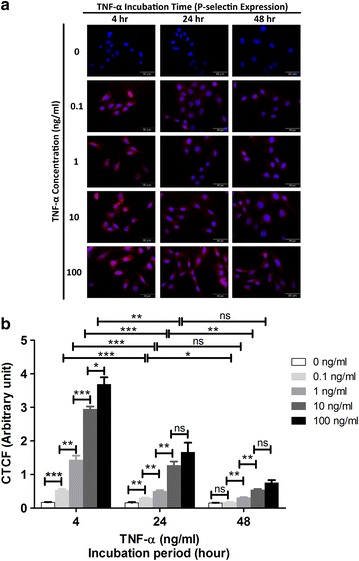
Immunocytochemistry for P-selectin on activated mAEC by different concentrations of TNF-α (0.1, 1, 10, 100 ng/mL) at different incubation period (4, 24, 48 h). a Red fluorescence signal for P-selectin expression. Blue DAPI staining for cell nuclei. Magnification ×60. b The intensity of staining obtained with anti-P-selectin antibody was quantified as corrected total cell fluorescence (CTCF) (mean ± SEM). Statistical significance is established at P < 0.05 (*P < 0.05, **P < 0.01, ***P < 0.001) and ns represents not significant
