Fig. 5.

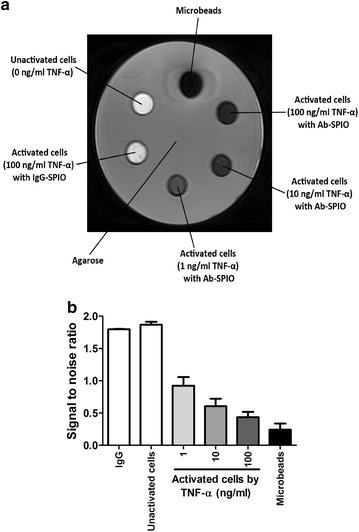
The transaxial view of cell phantom MRI. a T2 sequence. In clockwise direction: the microbeads, activated mAEC stimulated by TNF-α of different concentrations (100, 10 and 1 ng/mL), activated mAEC added with biotinylated IgG antibodies and microbeads and unactivated mAEC. b The S/N in streptavidin microbeads, positive control, was the smallest amongst all the samples. The activated cells stimulated by higher concentration of TNF-α produced a lower S/N. By contrast, the negative controls: (1) unactivated mAEC, and (2) activated mAEC added with biotinylated IgG antibodies and microbeads produced high S/N
