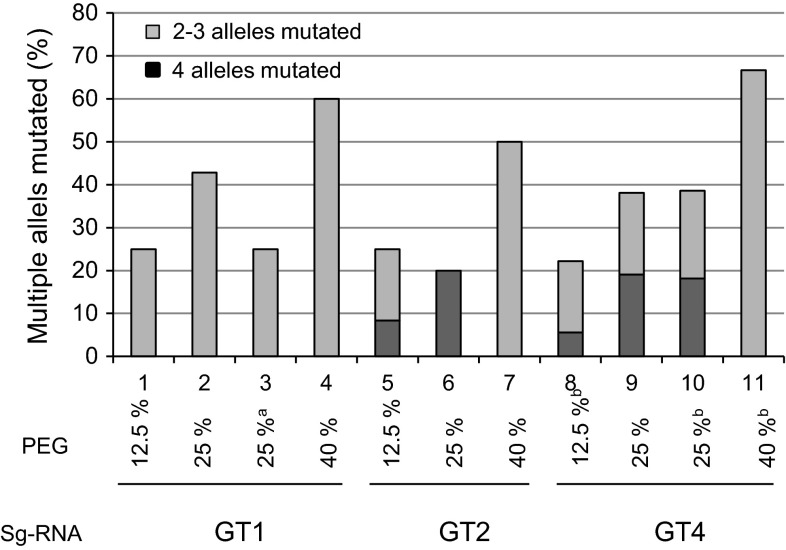
Fig. 4.
Frequency of mutated lines with multiple alleles targeted. The result is calculated based on all mutated lines regenerated in each experiment (%) analysed with high-resolution fragment analysis. aGT1 and Cas9 expressed from separate vectors. b Solanum tuberosum U6 promoter driving the sgRNA expression. n = 2–44

