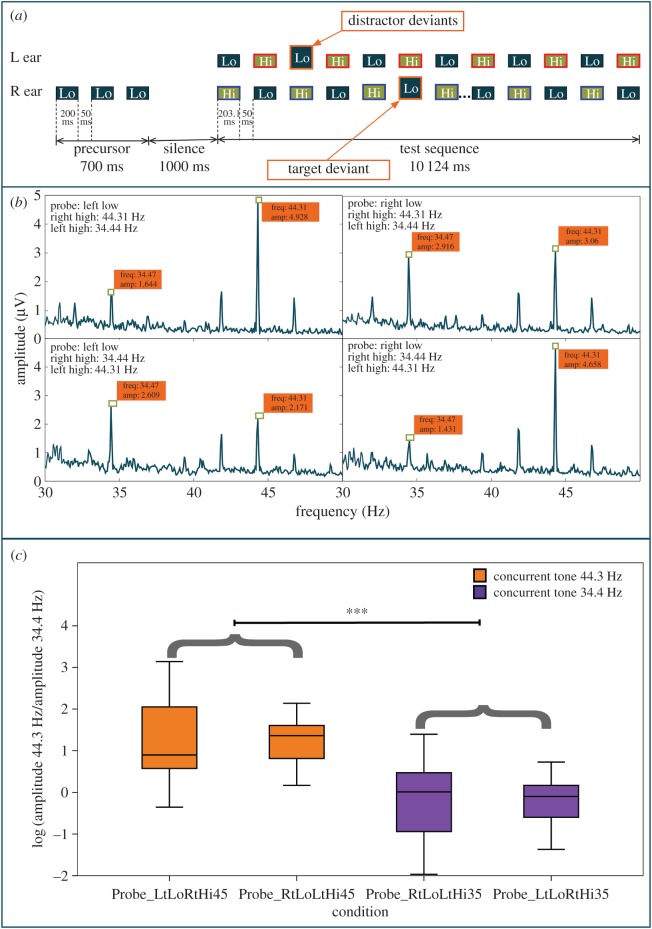
Figure 2.
Stimulus and results for experiment 2. (a) Test stimuli example. Each ear was presented with opposing, alternating frequency sequences of pure tones (Lo = 1000 Hz with no modulation; Hi = 2996 Hz tagged with modulation frequencies of 34.47 Hz or 44.31 Hz). Listeners were cued to focus on the low-frequency precursor on either side, as indicated by a cueing sequence, and were asked to detect target amplitude deviants. The schematic diagram below shows a sample trial where the right ear and left ear high tones are differentially tagged (red and blue outlines) and the low-frequency tone cues are in the right ear. (b) Amplitude spectrum of the EEG responses at the tagged frequencies. (c) The amplitudes of the EEG responses at the tagged frequencies for each test condition were calculated as the natural logarithmic transform of the ratio of the amplitude of 44.31 Hz component to the amplitude of 34.47 Hz component. In conditions where the synchronous tone was tagged with 44.31 Hz, the ratio was found to be significantly higher than in the conditions where the synchronous tone was tagged with 34.47 Hz. The x-axis conditions indicate the type of cue and tagged frequency. For example, ‘Probe_LtLoRtHi44’ indicates that the cueing sequence was a low-frequency sequence in the left ear and the high-frequency tones synchronously presented with the cued sequence, i.e. RtHi, were tagged with a 44.31 Hz tag, whereas the alternating high tones were tagged with 34.47 Hz.

