Fig. 1.
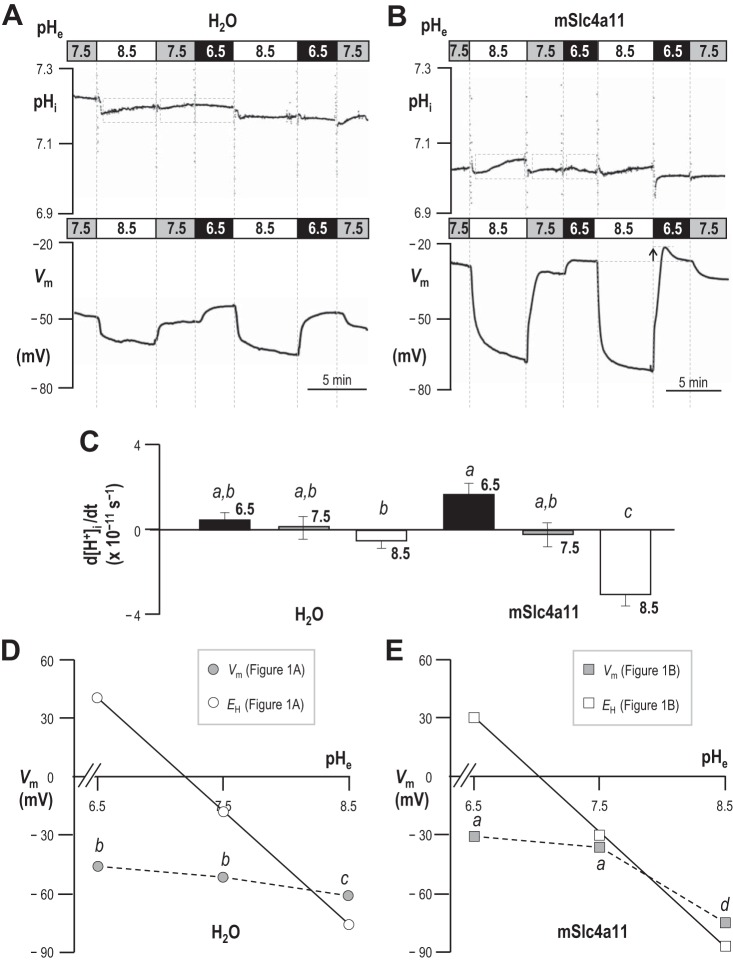
Extracellular pH (pHe)-dependence of membrane potential (Vm) and intracellular pH (pHi) in H2O-injected and mSlc4a11-expressing oocytes. A and B: pHi and Vm of an oocyte that had been injected with H2O (A) or mSlc4a11 cRNA (B) was monitored while the cell was exposed to extracellular solutions of pH 6.5, 7.5, or 8.5. The gray dashed boxes exemplify the periods over which the rates of [H+] change were calculated for C (i.e., omitting rapid changes close to the time of solution change that could be associated with artifacts or other non-Slc4a11-dependent phenomena). The arrow in B shows an enhanced depolarization of cells in pHe = 6.5 solution following exposure to pHe = 8.5 solution. C: the rate of change of intracellular [H+] during exposure to pHe = 6.5, 7.5, or 8.5 solutions (n = 6). Rates were calculated from the change in [H+] that occurred during the periods such as enclosed by gray boxes in A and B. The letters above each bar denote statistically indistinguishable groups reported by general linear model with Tukey's post hoc analysis (confidence interval 95%). D and E: average Vm of H2O-injected (D) or mSlc4a11-expressing (E) cells during exposure to pHe = 6.5, 7.5, or 8.5 solutions (gray data points), with letters to denote statistically indistinguishable groups. Vm values were taken at the end of the exposure period to each solution. For each value of pHe, each “n” represents an averaged value from the 2–3 exposure periods to which each cell was subjected. The white data points indicate the equilibrium potential for H+ determined at the average pHi from A or B at each value of pHe. Note that standard error bars are included but are eclipsed by the data point markers.

