Fig. 3.
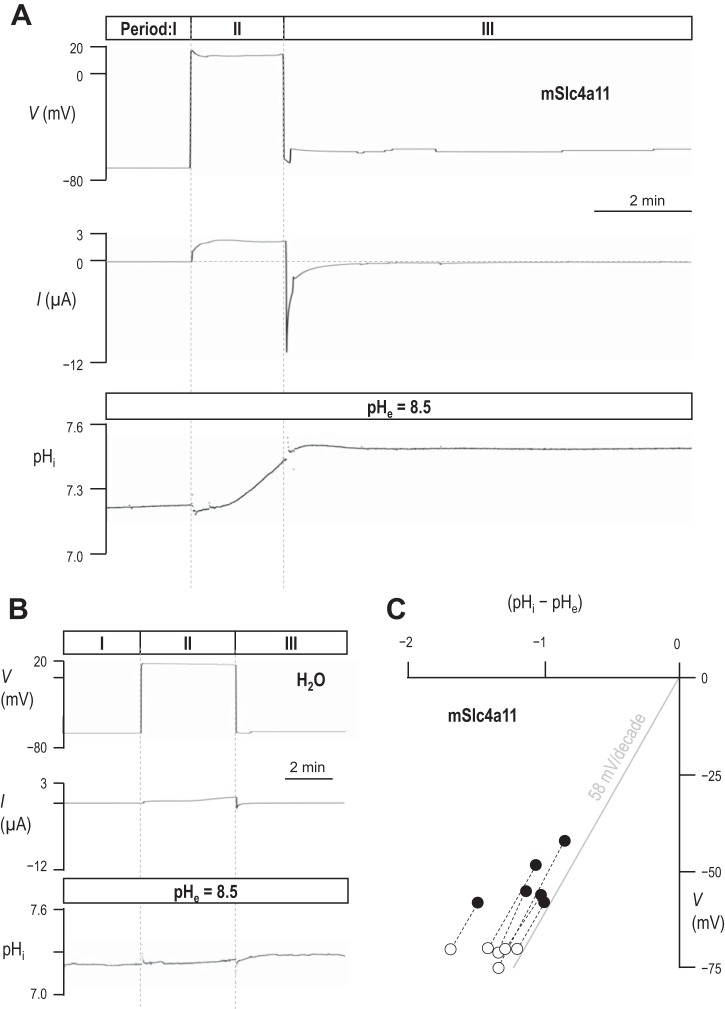
The relationship between pHi and Vm in H2O-injected and mSlc4a11-expressing oocytes. A and B: representative voltage, current, and pHi traces recorded from an mSlc4a11-expressing (A) and a H2O-injected oocyte (B) exposed to pHe = 8.5 solution. During Period I, Vm was clamped at its spontaneous (zero-current) value. During Period II, Vm was clamped to +20 mV to drive electrogenic acid extrusion. During Period III, Vm was clamped at its new zero-current value, reflecting the increased pHi. C: a plot of zero-current Vm vs. transmembrane pH gradient from six cells such as that represented in A. White data points were collected from each cell during Period I in A. Black data points were collected towards the end of Period III in A.

