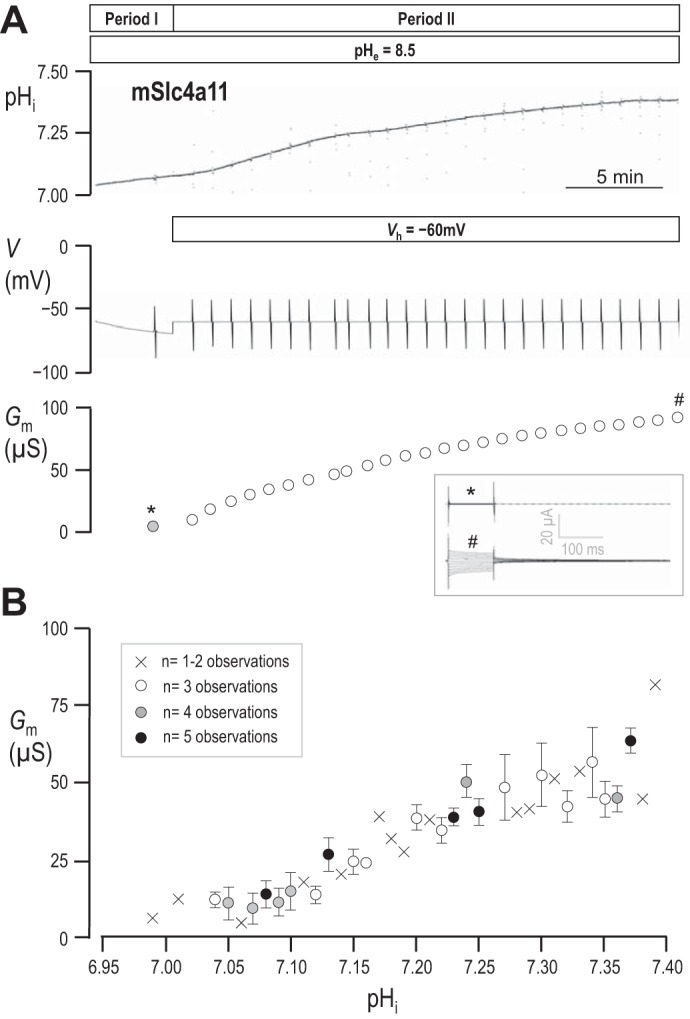
Fig. 4.

The relationship between pHi and Gm in mSlc4a11-expressing oocytes. A: representative pHi and voltage traces recorded from an mSlc4a11-expressing cell during exposure to pHe = 8.5 solution prior to, and during, voltage-clamp at −60 mV to drive electrogenic acid-extrusion. The deflections in the voltage trace denote the points at which current-voltage relationships were obtained. The values of G calculated for the cell at each point are plotted in bottom panel; the gray data point was obtained prior to the application of the voltage-clamp while the cell was spontaneously hyperpolarizing towards initial EH. The inset shows the current ladders at the measurement points labeled * and #. B: the relationship between pHi (rounded to 2 decimal places) vs. Gm averaged from data gathered from six mSlc4a11-expressing cells. Low confidence observations are marked with crosses, higher confidence observations are marked with open or filled circles accompanied by standard error bars.
