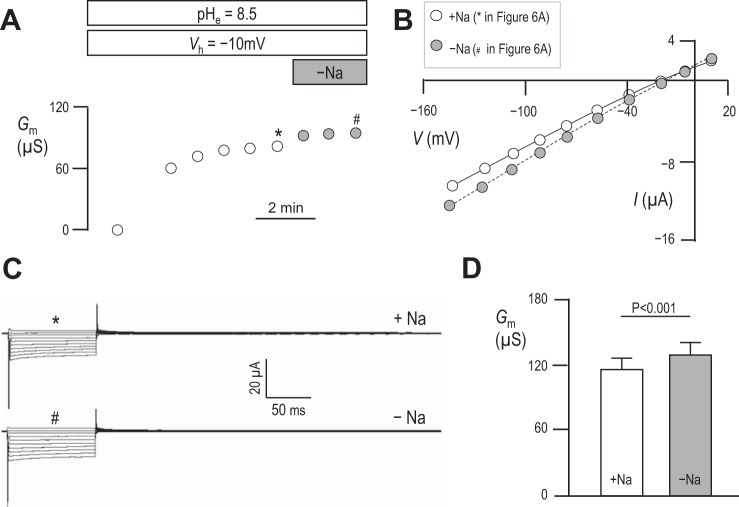
Fig. 6.
The influence of extracellular Na+ on Gm in mSlc4a11-expressing oocytes. A: representative experiment showing progressive changes in Gm in an mSlc4a11-expressing oocyte clamped at −10 mV in pHe = 8.5 solution. Gray data points indicate measurements made in Na+-free solution. B and C: data points in A marked with * and # are generated from data similarly marked in B accompanying representative I–V plots and C accompanying current ladders. D: averaged data from six cells showing the influence of extracellular Na+ on Gm. Statistic is the result of a two-tailed, paired t-test. Data equivalent to that shown in A–D, but showing the influence of extracellular Na+.

