Fig. 5.
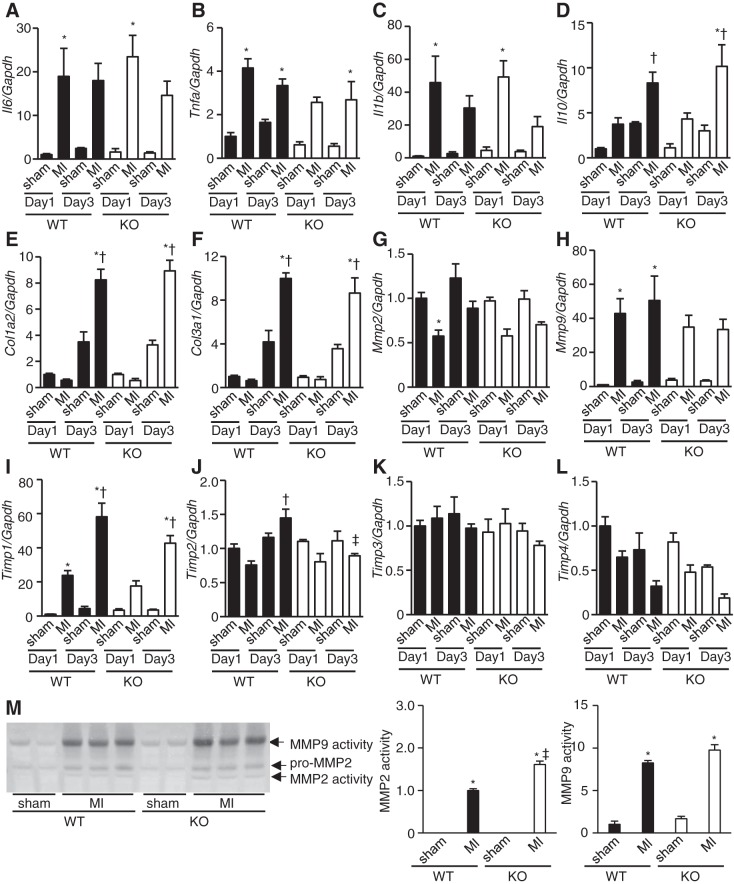
mRNA expression levels of interleukin-6 (Il6; A), tumor necrosis factor-α (Tnfa; B), interleukin-1β (Il1b; C), interleukin-10 (Il10; D), collagen type Iα2 (Col1a2; E), collagen type IIIα1 (Col3a1; F), matrix metalloproteinase (Mmp) 2 (G), Mmp9 (H), tissue inhibitor of metalloproteinase (Timp) 1 (I), Timp2 (J), Timp3 (K), and Timp4, (L) corrected by Gapdh levels 1 and 3 days after myocardial infarction (MI) in WT and TLR9-KO (KO) hearts (n = 4–7 mice for each group). Day 1: 1 day after MI; Day 3: 3 days after MI. M: the typical image (left) and the result of densitometoric analysis (right, n = 3 mice for each group) of gelatin zymography using heart homogenates on Day 3. Data were analyzed by one-way ANOVA and are expressed as means ± SE *P < 0.05 vs corresponding sham-operated hearts. †P < 0.05 vs MI mice on Day 1 in the same genotype. ‡P < 0.05 vs MI mice in WT group on Day 3.

