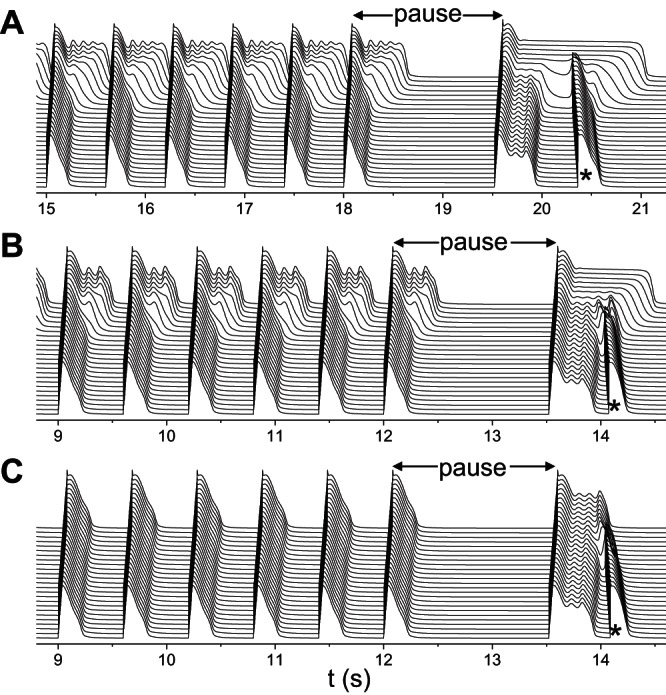
Fig. 10.

Pause-induced arrhythmias. Space-time plots of voltage showing pause-induced PVCs (*). The same heterogeneous cable as in Fig. 4B was used with GKs1 = 1 mS/μF. A: large RG. GCa,L = 152 mmol/(cm,C) and GKs2 = 0.27 mS/μF. B: intermediate RG. GCa,L = 176 mmol/(cm,C) and GKs2 = 0.45 mS/μF. C: small RG. GCa,L = 176 mmol/(cm,C) and GKs2 = 0.93 mS/μF. The cable was paced at 600 ms for 30 beats in A and 20 beats in B and C followed by a last pacing stimulation that was applied at a coupling interval of 1,500 ms.
