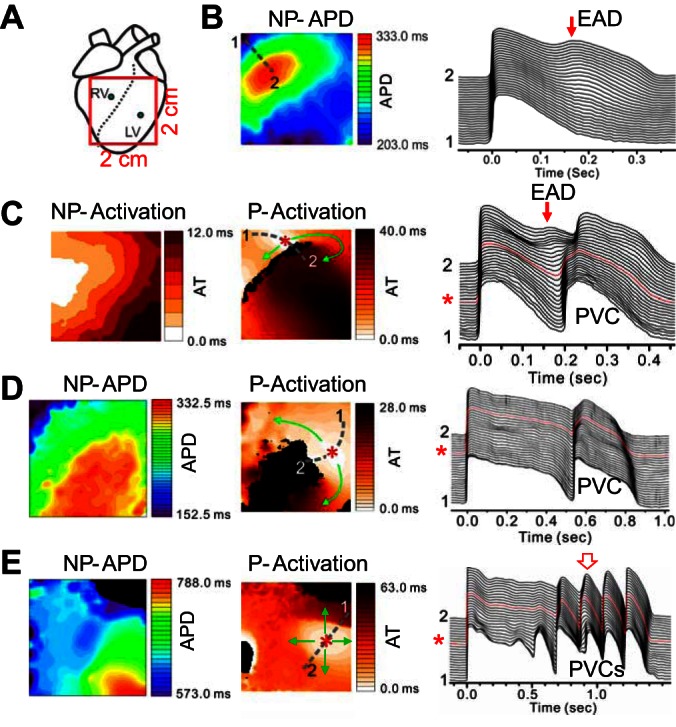
Fig. 2.

Repolarization gradient-induced premature ventricular complexes (PVCs) in transgenic LQT2 rabbit hearts. A: schematic plot of the optical mapping field on the anterior surface. B: action potential duration (APD) distribution (left) and space-time plot of voltage (right, along the broken line from position 1 to position 2 marked on left) for a non-PVC beat after infusion of isoproterenol. C: 10 s later in the same heart as in B, a PVC was triggered following a non-PVC excitation (see right). Left, activation map of the normal excitation. Middle, activation map of the focal excitation. Arrows indicate the directions of propagations, and * marks the initiation site. Right, space-time plot of voltage showing the non-PVC and the focal excitation (marked as PVC) beats. D: a PVC following a non-PVC excitation in a different rabbit heart. Left, APD map of a non-PVC excitation beat. Middle, activation map of the PVC beat. Right, space-time plot of voltage showing the non-PVC and the focal excitation (marked as PVC) beats. E: repetitive PVCs originating from the same site propagate in all directions in a different rabbit heart. Left, APD map of a non-PVC excitation beat. Middle, activation maps of the second PVC beat as marked by the open arrow on the right. Right, space-time plot of voltage showing the non-PVC and the PVC beats. The abbreviated labels above the maps are: NP-APD-APD map of a non-PVC beat; NP-Activation-Activation map of a non-PVC beat; and P-Activation-Activation map of a PVC beat.
