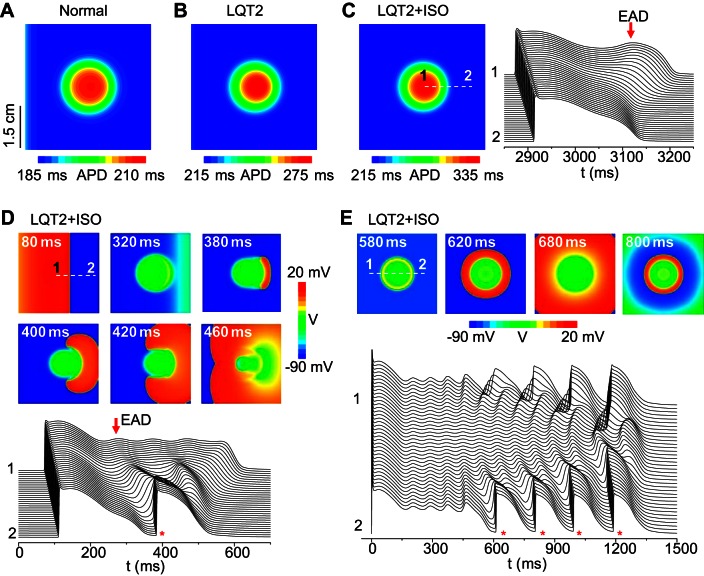
Fig. 3.
Repolarization gradient-induced PVCs in a 2D tissue model. A: APD distribution under normal control. GCa,L = 40 mmol/(cm,C), maximum conductance of the slow component of the delayed-rectifier potassium current (GKs1) = 0.7 mS/μF; GKs2 = 0.43 mS/μF; and GKr = 0.01 mS/μF. B: APD distribution under simulated LQT2 (GKr = 0). The parameters are the same as in A except GKr = 0. C: APD distribution (left) and space-time plot of voltage (right) under simulated LQT2 conditions with a low isoproterenol effect. GCa,L = 60 mmol/(cm,C), GKs1 = 0.9 mS/μF, and GKs2 = 0.56 mS/μF. Note the difference in color scales in A–C. D: voltage snapshots (marked by timing) and space-time plot (bottom) under simulated LQT2 with a higher isoproterenol effect. GCa,L = 176 mmol/(cm,C), GKs1 = 1.1 mS/μF, and GKs2 = 0.7 mS/μF. E: voltage snapshots (marked by timing) and space-time plot (bottom) under simulated LQT2 with a high ICa,L. GCa,L = 276 mmol/(cm,C), GKs1 = 0.7 mS/μF, and GKs2 = 0.6 mS/μF. The white broken lines in C, D, and E mark the locations (from 1 to 2) for the corresponding space-time plots of voltage. Red arrows in C and D mark early afterdepolarizations (EADs). * in D and E marks the PVC beats. Tissue size is 4.5 cm × 4.5 cm. APD gradient was modeled by a smaller GKs (GKs2) in the circular region (r = 0.9 cm) in the center, and all other parameters in the tissue are uniform. A stimulus was given at the left side of the tissue in all cases except E in which the stimulus was given to all cells at time (t) = 0.

