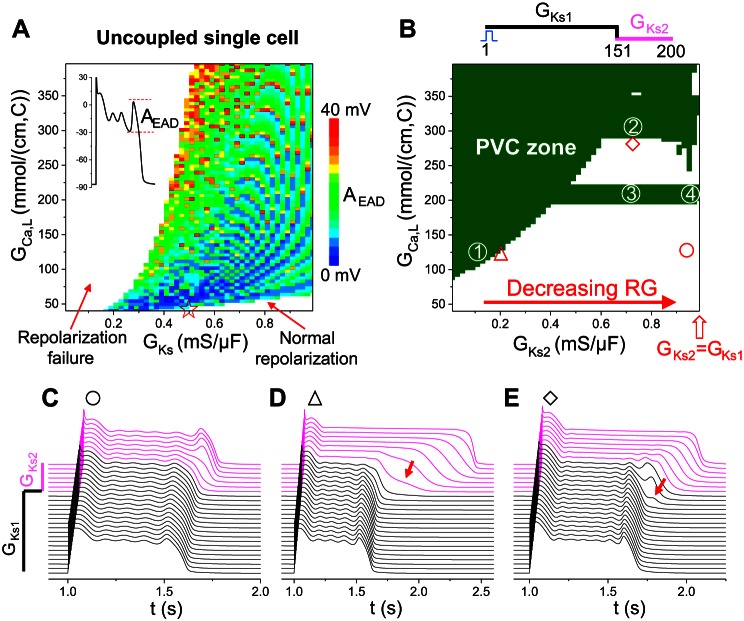
Fig. 4.
Tissue-scale EADs and PVCs in a heterogeneous 1D cable. A: EAD amplitude (AEAD) distribution from an isolated single cell by scanning GCa,L and GKs. GKr = 0. AEAD (indicated by color) was defined as in the inset, which was the largest of the EADs in an AP. The red star on the x-axis indicates the control condition of LQT2 whose AP was shown in Fig. 1C. B: PVC zones (olive) for different combinations of GCa,L of the whole cable and GKs (GKs2) in the long APD region. Simulations were carried out in a 200-cell cable with GKs1 being used for the first 150 cells and GKs2 for the remaining 50 cells. All other currents are uniform in the whole cable. GKs1 = 1 mS/μF and GKr = 0. C–E: space-time plots of voltage for three different combinations of GCa,L and GKs2 as marked by symbols in B. GCa,L = 125 mmol/(cm,C) and GKs2 = 0.942 mS/μF for C, GCa,L = 120 mmol/(cm,C) and GKs2 = 0.19 mS/μF for D, and GCa,L = 287 mmol/(cm,C) and GKs2 = 0.71 mS/μF for E. Arrows in D and E indicate phase 3 EADs. The magenta traces in C–E are voltage traces from the cells with the small GKs (GKs2), and the black ones are from the cells with the large GKs (GKs1).

