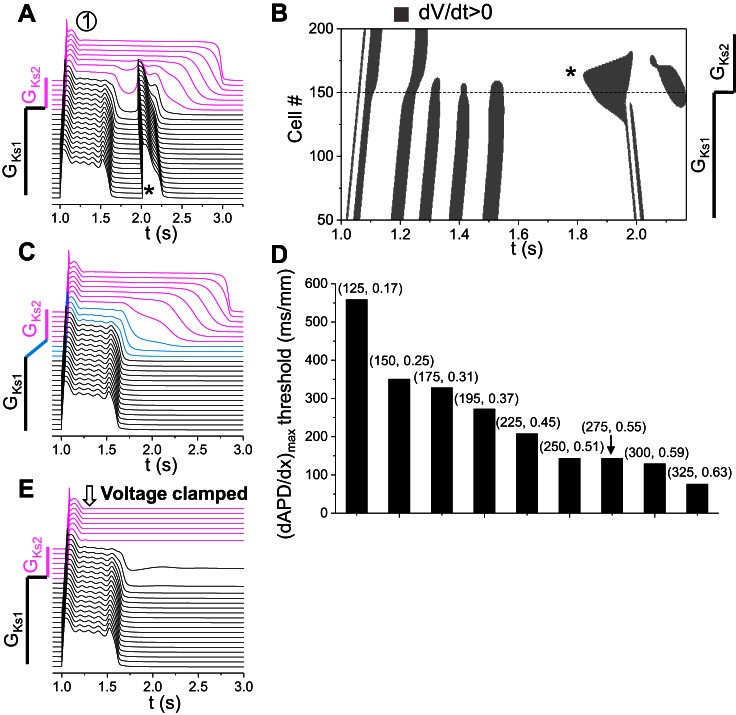
Fig. 6.
Large RG-induced PVCs. A: space-time plot of voltage showing a PVC (*) generated due to RG via the first mechanism (location “1” in Fig. 4B). GCa,L = 120 mmol/(cm,C) and GKs2 = 0.15 mS/μF. B: space-time plot of dV/dt > 0 for the voltage shown in A. C: same as A, but the change of GKs1 to GKs2 occurred across 20 cells, and the PVC disappeared. D: critical APD gradient (maximum APD gradient in the cable) for PVC genesis for the parameter set (GCa,L, GKs2) as marked. E: same as A, but the cells in the long APD region are voltage clamped at their value at t = 1,160 ms.

