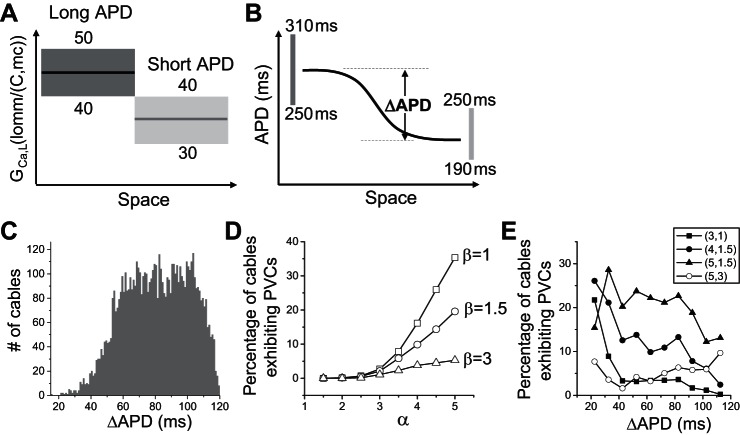
Fig. 9.
Population-based analysis of PVC genesis. A: schematic plot of the assigned GCa,L ranges and heterogeneity in the 1D cable model in which two GCa,L values randomly drawn from the assigned ranges were used for each cable. The cable length was 200 cells, and the long and short APD regions were each 100 cells. We assigned the GCa,L range from 40 to 50 mmol/(cm,C) in the long APD region and 30 to 40 mmol/(cm,C) in the short APD region. The same two-region heterogeneity was used for the slow transient outward K current (Ito,s), the fast transient outward K current (Ito,f), and IKs with the following assigned maximum conductance ranges (in the same units as in the original model): slow transient outward conductance (Gto,s, 0.01, 0.04), fast transient outward conductance (Gto,f, 0.01, 0.11), and GKs (0.3, 0.7) in the long APD region; and Gto,s (0.04, 0.08), Gto,f (0.11, 0.22), and GKs (0.7, 1.3) in the short APD region. IK1, Na/Ca exchange current (INCX), and INaK are uniform in space with the following assigned maximum conductance ranges: GK1 (0.1, 0.5), Na/Ca exchange conductance (GNCX, 0.5, 1), and maximum conductance of IKs (GNaK, 1.0, 2.0). B: schematic plot of the assigned APD ranges in the 1D cable model. The solid line represents an APD distribution of a specific cable, and ΔAPD was defined as the maximum APD less the minimum APD in this cable. The two vertical bars indicate the allowed APD ranges for the maximum APD and minimum APD, respectively. C: histogram of ΔAPD from the 6,000 cables satisfying the APD requirements described in B. D: percentage of cables exhibiting spontaneous PVCs at different levels of the isoproterenol effects described by α and β. α is the multiplier of ICa,L, and β is the multiplier of IKs. E: percentage of cables exhibiting spontaneous PVCs vs. the initial ΔAPD before isoproterenol (α = β = 1, the same ΔAPD data presented in C) for different combinations of α and β as indicated by different symbols.

