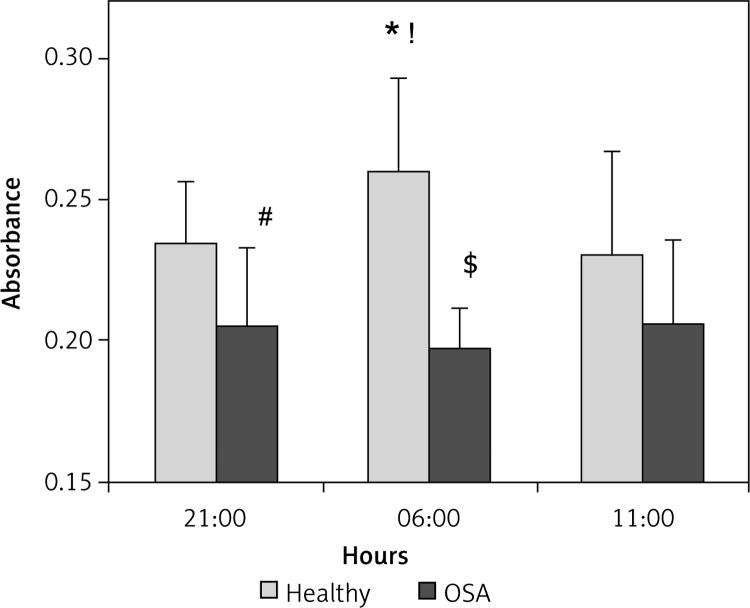
Figure 1.
Endothelial cell migration (ECM) in response to serum obtained from healthy controls (n = 12) and OSA subjects (n = 12). The ECM in response to serum obtained from healthy individuals shows a diurnal profile with a peak of absorbance measured at 6:00 (*p = 0.02 vs. 21:00, and !p = 0.03 vs. 11:00). This pattern was disrupted in OSA patients, in whom chemo-attractant activity was weaker than in normal controls at 21:00 (#p = 0.02) and at 6:00 ($p < 0.001), and did not change significantly at the different time-points (p < 0.001 OSA vs. controls)
Data are presented as mean values (bars) with SD (whiskers). T-tests for direct comparisons and ANOVA with repeated measurements for time-related assessment.

