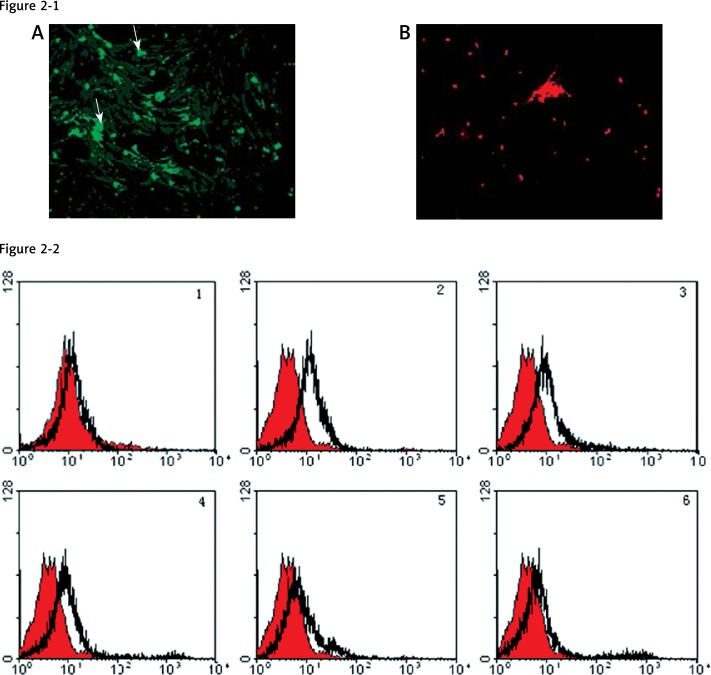
Figure 2.
Gap junctions between MM and BMSCs. Microscopic photographs (2-1) from the double labeling of MM cells with calcein-AM (green) and DiI (red) show that dye transfer occurs from myeloma cells to BMSCs (A) and that dye is not permeating from the cells stained with DiI (B), confirming that GJIC is functional between the two cells, and that the dye-transfer was specific. FCM histograms (2-2) of RPMI 8266 after dual-labeled MM were administered onto BMSCs in a parachute assay, with GJs allowed to form. The FCM data show the percentage of BMSCs into which calcein-AM was transferred from MM cells after the cultures were treated with various concentrations of heptanol (0–100 mM/l). No. 1 displays the negative control samples. In the experimental cell population, many cells do not take up dye (overlapping with the negative control population), and shift to the right of the negative control population (which have taken up the dye (2–6))

