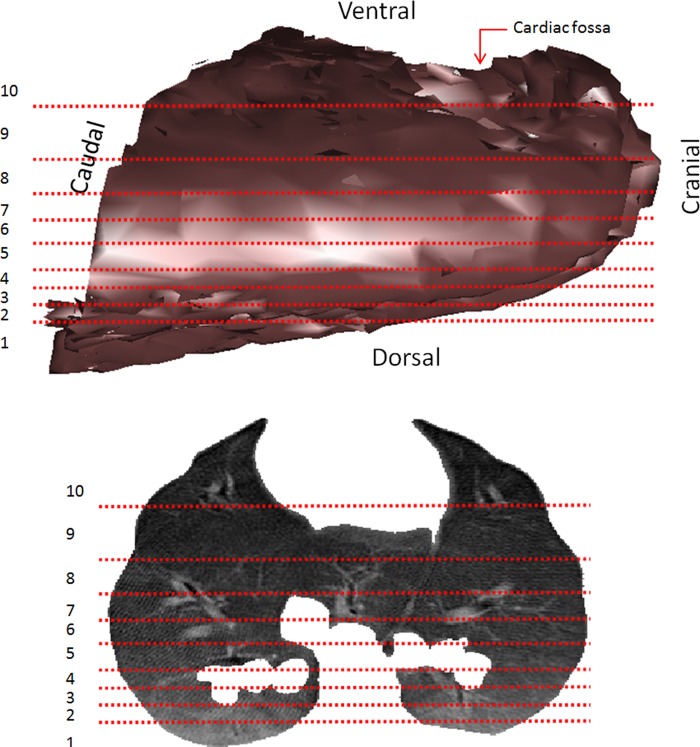
Fig. 1.
Regions of interest (ROIs) used in the analysis. Computed tomography (CT) three-dimensional reconstructed images of whole lungs (top) and one slice of the lungs (bottom). Horizontal lines represent boundaries of 10 ROIs with equal tissue volume. The most dorsal (1) and the most ventral (10) ROIs were excluded from the analyses due to larger boundary effects. Gray scale (top) represents a three-dimensional light shadow effect. Gray scale (bottom) is based on Hounsfield units, where black = air and white = dense bone.

