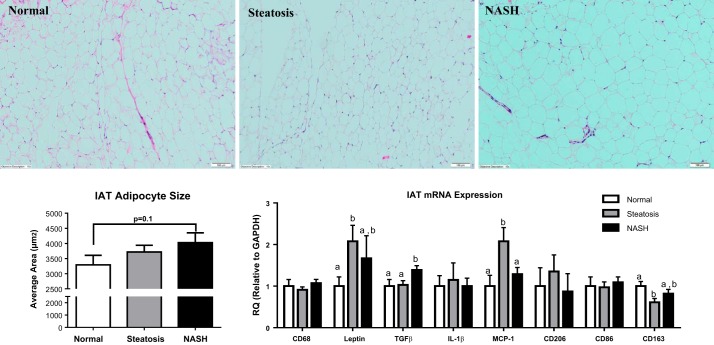
Fig. 2.
Intra-abdominal adipose tissue (IAT) morphology and mRNA expression by quantitative RT-PCR. A: representative H&E stain of IAT from patients with normal liver, hepatic steatosis, and NASH. B: quantitative analysis of IAT adipocyte size representing the mean of 300–500 adipocytes per subject. C: mRNA expression in IAT of key inflammatory genes. Different letter superscripts denote significant differences (P < 0.05) between groups.

