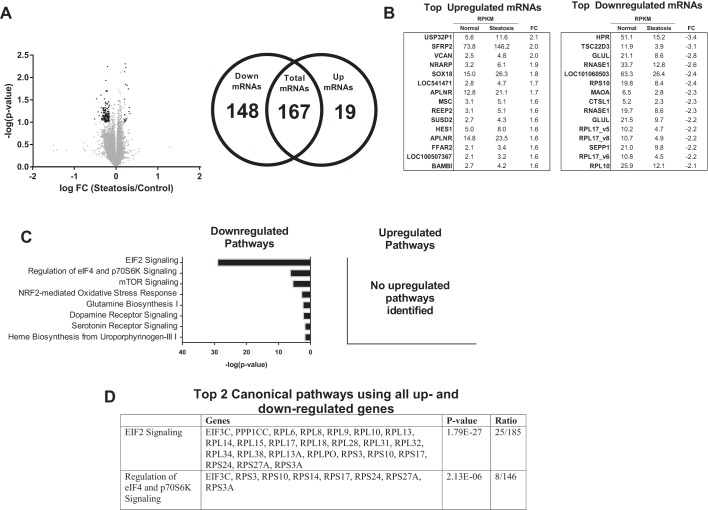
Fig. 3.
Transcriptome analysis of IAT in patients with Steatosis vs. Normal liver phenotype. A: 14,121 transcripts were initially identified [gray dots; reads per million (RPM) > 0, reads per kilobase per million reads (RPKM) > 2]; 167 were determined to be statistically differentially regulated [black dots; >1.5-fold difference, false discovery rate (FDR) < 0.10], of which 19 were significantly upregulated and 148 significantly downregulated. B: top 15 individual up- and downregulated transcripts between Normal and Steatosis. C: top 8 downregulated pathways identified by Ingenuity Pathway Analysis (IPA), no upregulated pathways were identified. D: top 2 canonical pathways identified by IPA using all up- and downregulated genes. FC, fold-change.

