Fig. 6.
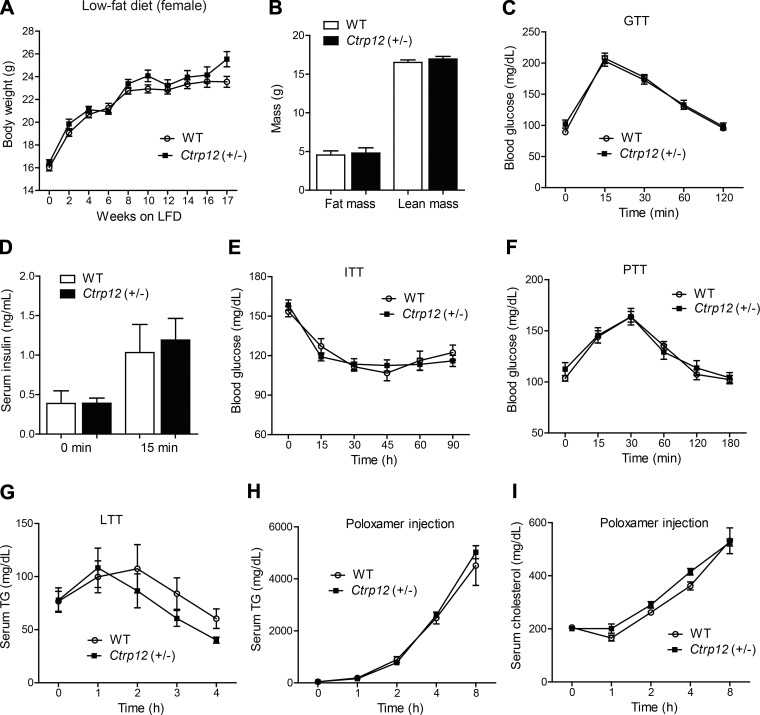
Body weight, body composition, and whole body glucose and lipid metabolism in LFD-fed WT and Ctrp12 (+/−) female mice. A: body weight gain over time of WT and Ctrp12 (+/−) female mice. B: NMR analysis of total lean and fat mass in WT and Ctrp12 (+/−) female mice at 20 wk of age. C: blood glucose levels of WT and Ctrp12 (+/−) females at 0, 15, 30, 60, and 120 min following glucose injection in a glucose tolerance test (GTT). D: serum insulin levels of WT and Ctrp12 (+/−) female mice at 0 and 15 min postglucose injection. E: blood glucose levels of WT and Ctrp12 (+/−) female mice at 0, 15, 30, 45, 60, and 90 min following insulin (1 U/kg body wt) injection in an insulin tolerance test (ITT). F: blood glucose levels of WT and Ctrp12 (+/−) female mice at 0, 15, 30, 60, 120, and 180 min following sodium pyruvate (1 g/kg body wt) injection in a pyruvate tolerance test (PTT). Serum levels of TG (G) and NEFA (H) in WT and Ctrp12 (+/−) female mice at 0, 1, 2, 3, and 4 h following an oral gavage of 20% Intralipid in a lipid tolerance test (LTT). I: serum levels of TG in WT and Ctrp12 (+/−) female mice at 0, 1, 2, 6, and 9 h following injection of Poloxamer 407 (1 g/kg body wt). Food was removed 4 h before Poloxamer injection (n = 10–13 per group).

