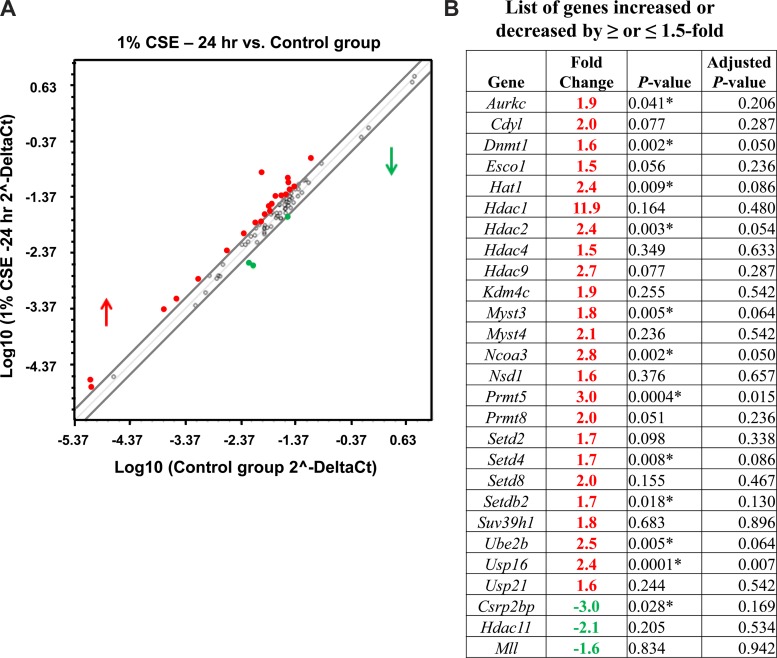
Fig. 1.
Gene expression profiles of chromatin modification enzymes that were increased above or below 1.5-fold cutoff in 24-h control vs. CSE-treated H292 cells. Human bronchial epithelial cells were treated for 24 h with or without CSE. RNA extracted from control and CSE-treated (1%) cells was analyzed using RT2 Profiler PCR array for human epigenetic chromatin modification enzymes. A: scatterplot analysis of human chromatin modification enzymes show marked upregulation or downregulation of genes by ≥ or ≤1.5-fold in 24-h control vs. CSE-treated (1%) H292 cells. Red denotes high expression (upregulated), and green denotes low expression (downregulated). Values are means ± SE (n = 4/group). B: table shows gene symbol, fold change, P value (Student's t-test; P < 0.01), and Benjamini-Hochberg adjusted P value (multiple-target analysis) for genes altered by CSE compared with control.

