Fig. 4.
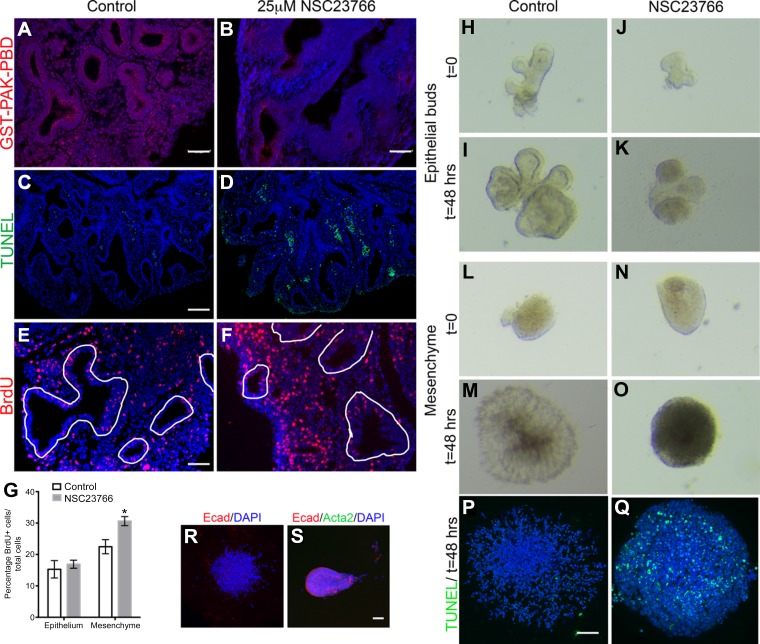
Rac1 inhibition leads to increased cell proliferation and cell death in the lung mesenchyme. A and B: GST-PAK-PBD staining on sections treated with 25 μM NSC23766 (B) vs. controls (A). C and D: TUNEL staining on E12.5 mouse lung sections cultured for 48 h in absence (C) or presence of 25 μM Rac1 inhibitor (D). E and F: BrdU staining on E12.5 mouse lung sections cultured for 48 h in absence (E) or presence of 25 μM Rac1 inhibitor (F). White lines delineate epithelial structures. G: quantification of BrdU-positive cells in either the epithelium or mesenchyme as percentage to the total number of cells within the appropriate each compartment in controls (white bars) and treated explants (gray bars). Data are represented as means ± SE of at least 6 independent samples, P = 0.002. H–K: cultured isolated epithelial buds from E11.5 mouse lungs at t = 0 (H and J) and t = 48 h (I and K) in presence of FGF10 alone (H and I) or FGF10 + NSC23766 (J and K). L–O: cultured isolated mesenchymal explants from E11.5 mouse lungs at t = 0 (L and N) and t = 48 h (M and O) in presence of FGF9 alone (L and M) or FGF9 + NSC23766 (N and O); n = 4 independent samples. P and Q: TUNEL staining on cultured isolated mesenchymal explants from E11.5 mouse lungs cultured for 48 h treated with FGF9 (P) or FGF9 + NSC23766 (Q). R: Ecad staining on cultured isolated mesenchymal explant from E11.5 mouse lung cultured for 48 h. S: Ecad and Acta2 staining on cultured isolated epithelial bud from E11.5 mouse lung at t = 0. Scale bars are 100 μm in A, C, P, and S and 50 μm in E.

