
Figure 3.
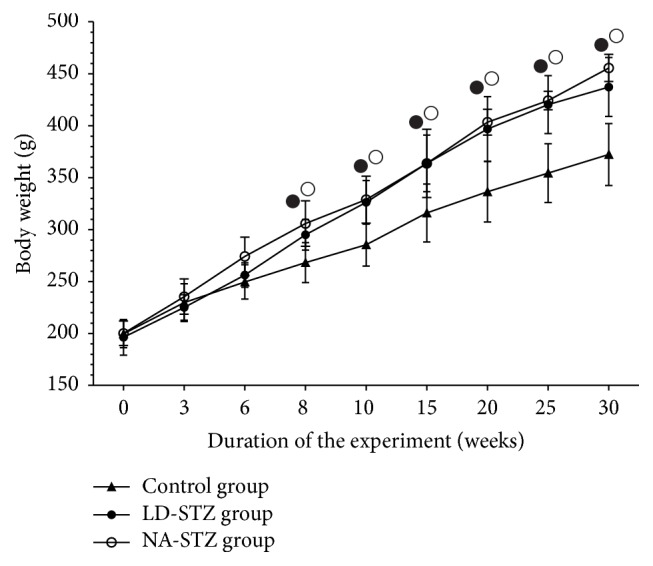
Changes in body weight (g) of rats in the experimental groups throughout the study. Dynamics of body weight starting at week 0 when unilateral nephrectomy was performed. LD-STZ and NA-STZ groups were fed with the diet containing beef tallow from week 3 till week 8 of the study. Mean values and standard deviations are shown. ○ – P < 0.05 in NA-STZ group versus control nondiabetic group; ● - P < 0.05 in LD-STZ group versus control nondiabetic group. Nonsignificant difference between NA-STZ and LD-STZ groups is not shown.